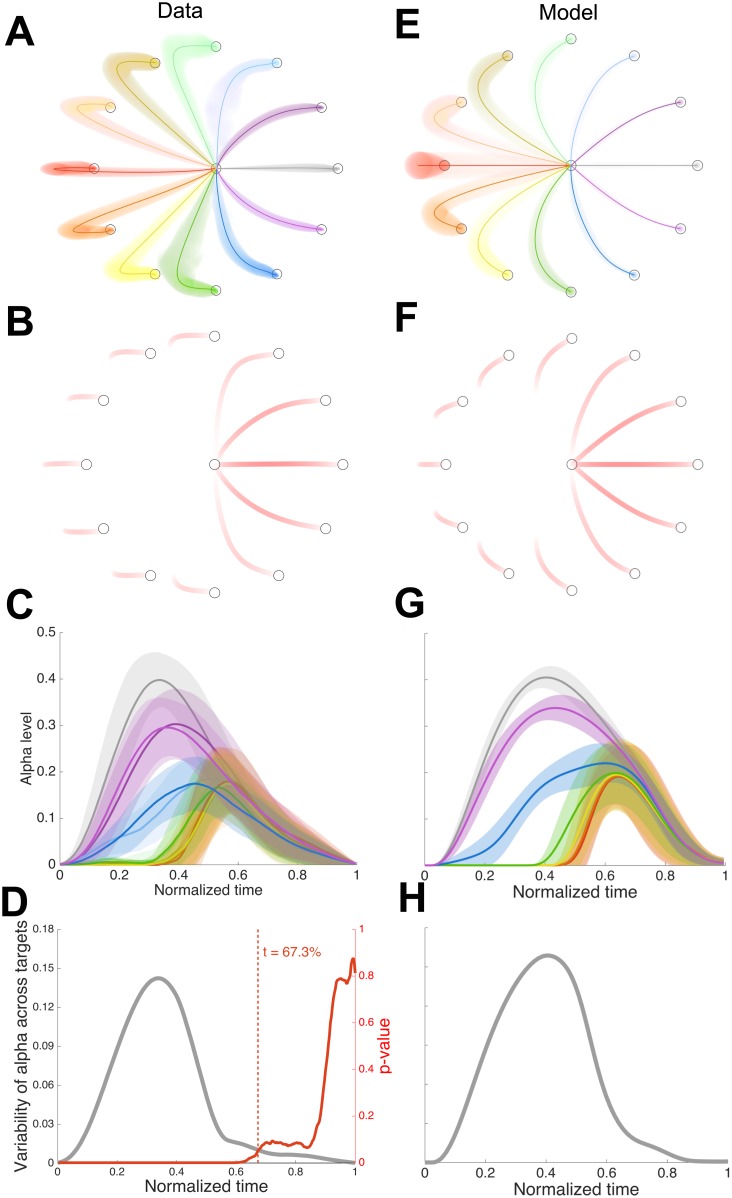
Fig 4. Empirical and simulated behavior in Experiment 1.
(A) average hand paths across subjects (mean ± s.d. across the subjects). (B) cursor visibility corresponding to the average hand trajectories in (A). (C) Alpha level (visibility) against normalized time for each movement direction (mean ± s.d. across the subjects). Colors as in (A). (D) Variance of alpha across the 12 target directions. Red line shows the p-value for the data based on an ANOVA across the 12 directions for each normalized time. The vertical red dashed line shows the last time p<0.05. (E)-(H) same as (A)-(D) for the model.

