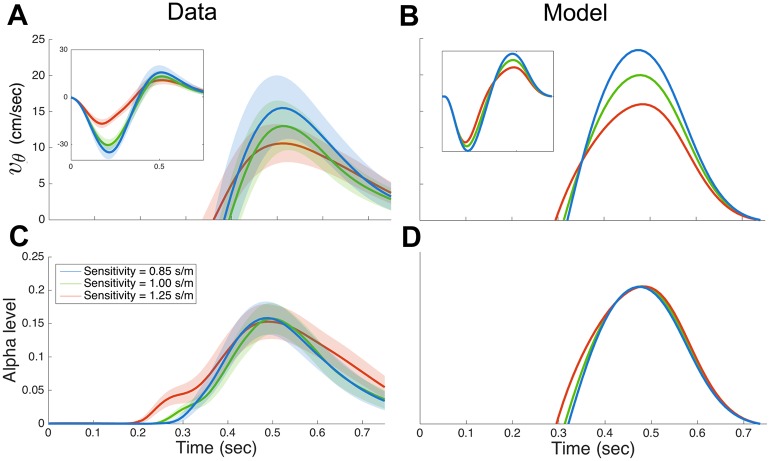
Fig 9. Temporal profiles of velocity in the visibility modulation direction and the corresponding alpha level in Experiment 2.
(A) Velocity in the visibility modulation direction for the three visibility sensitivities. Data shown mean ± s.d. across the last 50 trials of each sensitivity session. Inset shows the entire movement and the main figure is clipped to the positive velocities when the cursor was visible. (C) Alpha level for the three visibility sensitivities. Data shown mean ± s.d. across the last 50 trials of each sensitivity session. (C)-(D) same as (A)-(B) for the model (mean only).

