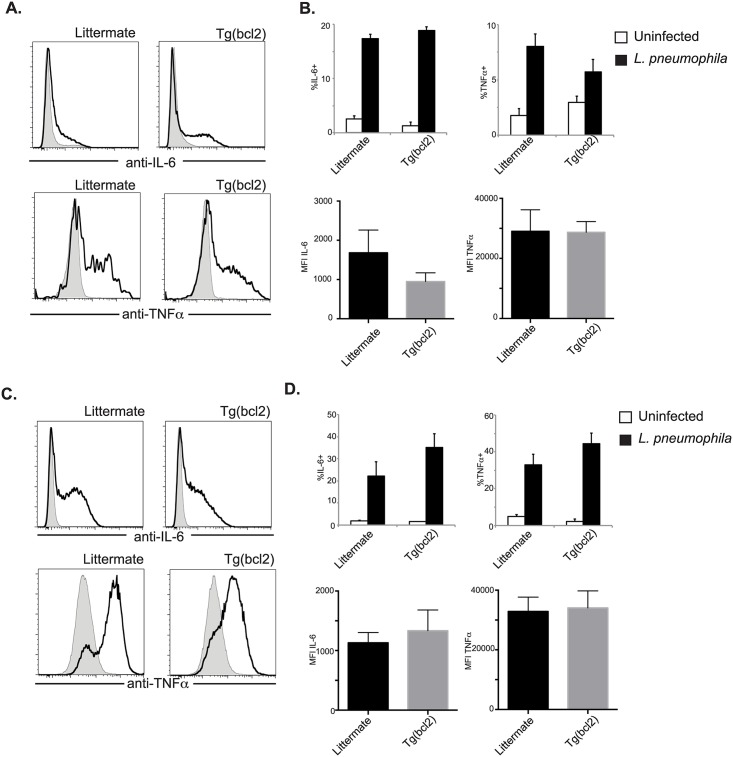
Fig 10. Cytokine production from DCs and macrophages after L. pneumophila infection.
Production of IL-6 and TNFα was measured by intracellular staining. Grey shaded histograms are uninfected and L. pneumophila infected are depicted with solid black lines. Representative staining of DCs is shown in (A), the percent of cells expressing cytokines is shown in (B top), and the MFI is shown in (B bottom). Representative staining of macrophages is shown in (C), the percent of cells expressing cytokines is shown in (D top), and the MFI is shown in (D bottom). These data are representative of at least 3 independent experiments with n = 3–4 per experiment. The mean values are displayed. * denotes P value < .05.

