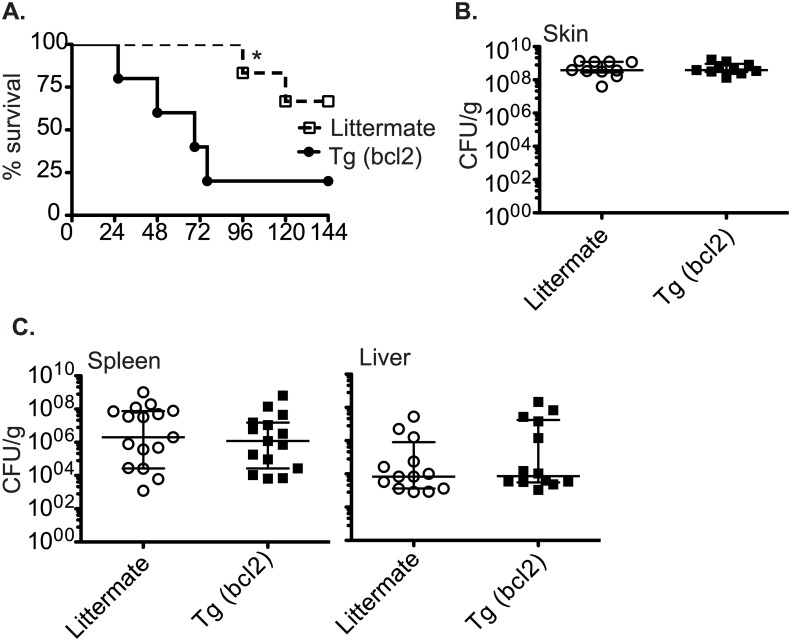
Fig 11. Survival and bacterial load in mice infected with S. pyogenes.
Survival of CD68(bcl2)tg mice compared to littermate controls after subcutaneous infection with 1X10⁷ S. pyogenes (A). Bacterial load in CD68(bcl2)tg mice compared to littermate controls at the site of infection as measured by CFU 2 days after infection. (B). Bacterial load in CD68(bcl2)tg mice compared to littermate controls in the livers and spleens as measured by CFU 2 days after infection. (C). Data shown represent 4 experiments with n = 3–4 per experiment. The median CFUS are displayed. * denotes P value < .05.

