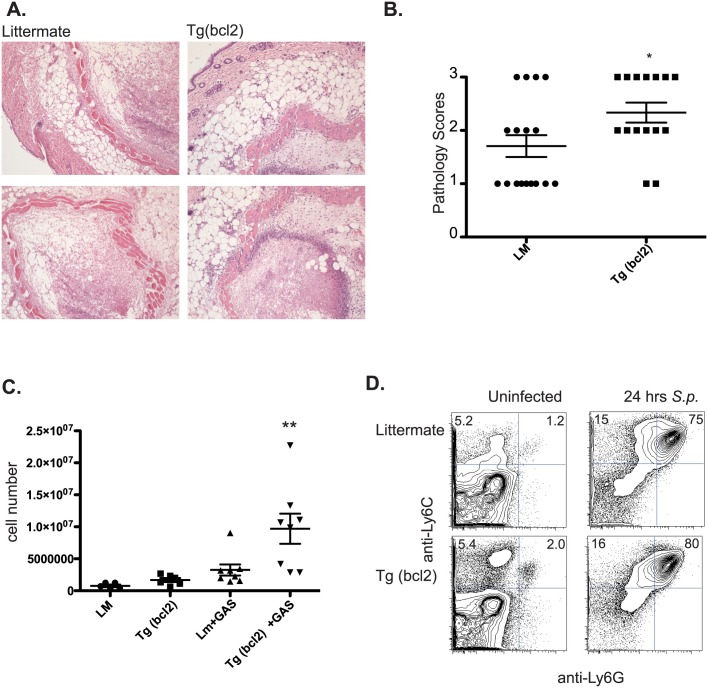
Fig 12. Immune cell infiltrate after infection with S. pyogenes.
Representative histology micrographs of infected skin from CD68(bcl2)tg mice and littermate controls from mice infected with S. pyogenes 2 days after infection (A). Pathology scores of skin from CD68(bcl2)tg mice and littermate controls 2 days after infection with S. pyogenes (B). Cell numbers in the peritoneal cavity of CD68(bcl2)tg mice and littermate controls 24 hours after injection of heat-killed S. pyogenes into the peritoneal cavity compared with uninfected controls (C). Flow cytometry staining of Ly6C+ and Ly6G+ cells in the peritoneal cavity of CD68(bcl2)tg mice and littermate controls before and after infection with S. pyogenes. These data are representative of at least 3 independent experiments with n = 3–4 per experiment. The mean values are displayed. * denotes P value ≤ 0.05. ** denotes P value ≤ 0.001.

