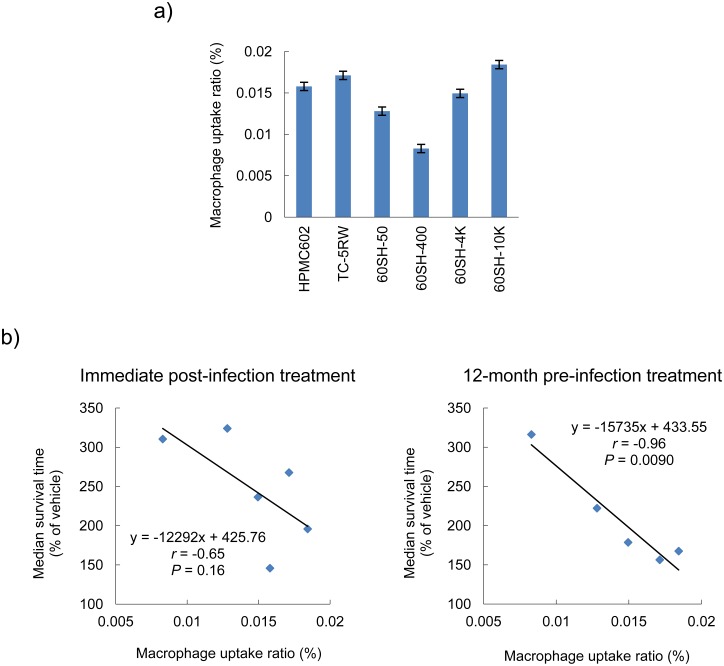
Fig 6. Macrophage uptake analysis.
(a) HPMC macrophage uptake ratio. This represents the percentage of the HPMC amount of macrophage lysate vs. the amount added into the culture medium. The mean and standard deviation of triplicate experiments are shown. (b) Analysis of the linear correlation between the macrophage uptake ratio and prophylactic efficacy of HPMCs. Survival times of Tg7 mice treated with HPMCs immediately post-infection or treated 12 months prior to infection were obtained from Figs 1c and 4a. Statistical correlations were identified using the Pearson’s correlation coefficient.

