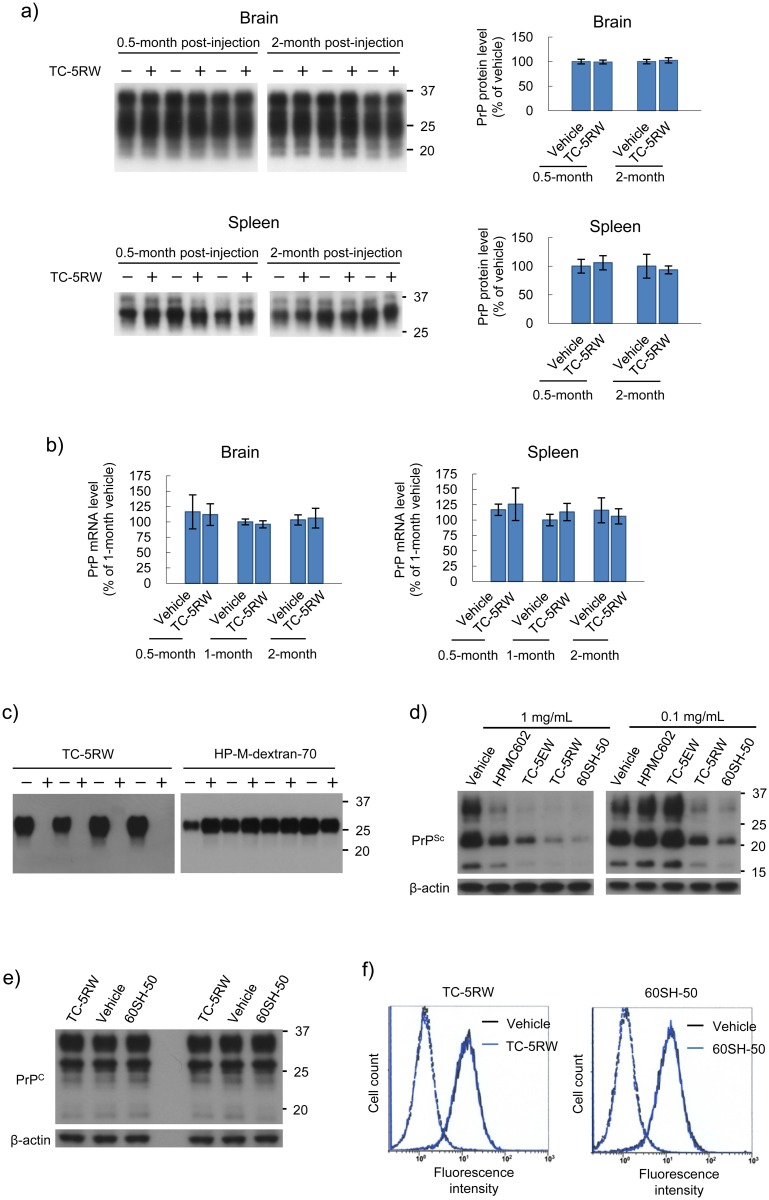
Fig 9. CE effects on PrP expression and PrPSc formation.
(a) Immunoblotting of PrPC in the brain and spleen from Tg7 mice treated with TC-5RW (4 g/kg body weight) or vehicle at the designated time points (n = 3 for each time point). Molecular size markers on the right indicate sizes in kDa. The mean and standard deviation are shown in each bar graph. (b) PrP mRNA expression level in the brain and spleen from Tg7 mice treated with TC-5RW (4 g/kg body weight) or vehicle at designated time points. The mean and standard deviation (n = 3 for each time point) are shown. (c) Immunoblotting of protease-resistant PrPSc in the protein misfolding cyclic amplification reaction performed in the presence of TC-5RW. Representative quadruplicate data are shown for the cyclic amplification of 263K prion performed in the presence (+) or absence (−) of TC-5RW or hydroxypropyl methyl dextran-70 kDa (HP-M-dextran-70) at a dose of 10 μg/mL. HP-M-dextran-70 was used as a negative control. In the absence of each compound, the vehicle, water, was added to the reaction mixture. (d) Immunoblotting of protease-resistant PrPSc in RML prion-infected N2a cells treated with HPMCs. Signals for β-actin are shown as controls for the integrity of samples used for PrPSc detection. The chemical property and in vivo efficacy of TC-5EW are shown in S4 Fig. (e) Immunoblotting of PrPC in uninfected N2a cells treated with HPMCs at a dose of 1 mg/mL in duplicate. (f) Flow cytometry of cell surface PrPC in uninfected N2a cells treated with HPMCs at a dose of 1 mg/mL. Black and blue lines indicate vehicle-treated cells and HPMC-treated cells, respectively. The broken line peaks on the left show the respective isotype controls.

