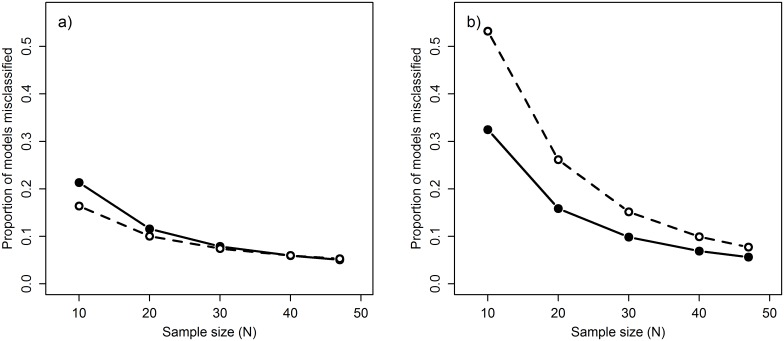
Fig 5. Relationship between sample size (N) and misclassification rate of climate signals.
Misclassification rate calculated using the metric PC both with 10-fold cross-validation (dashed line) and without cross-validation (solid line). Metric tested on datasets where a) a climate signal is present and b) a climate signal is missing. Note that misclassification in a) denotes false negatives while in b) it denotes false positives.

