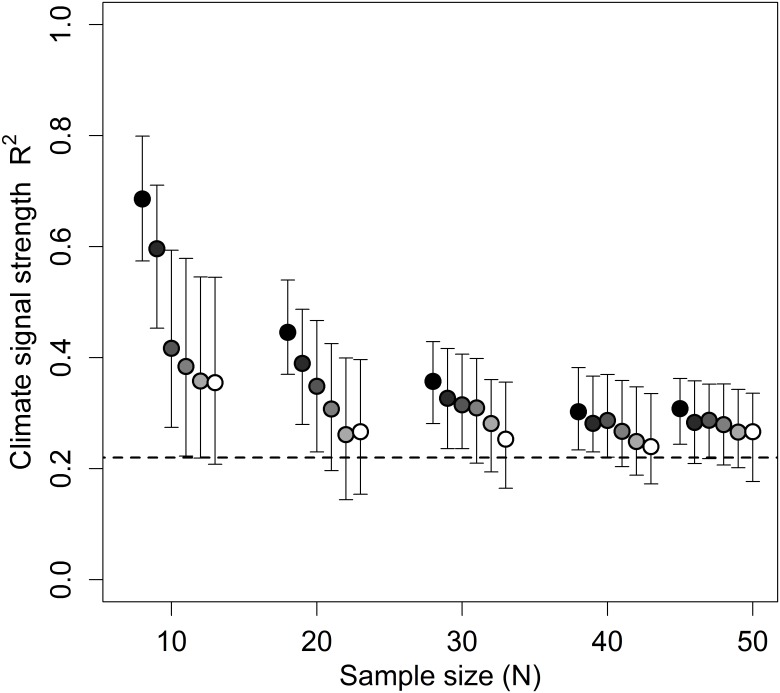
Fig 8. Effect of cross-validation folds (k) on the median R2 estimation of k-fold cross-validated slidingwin analysis.
Each point generated using 200 simulated datasets. The horizontal dashed line shows the true value of R2 used to generate the simulated datasets (R2 = 0.22). R2 was estimated using 0, 2, 4, 6, 8, or 10-folds (black to white respectively). Sample sizes of 10, 20, 30, 40, and 47 were used. Error bars represent inter-quartile range.

