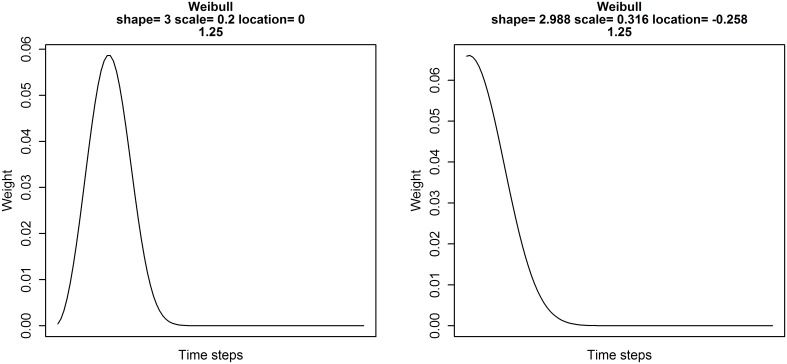
Fig 11. Weight distribution calculated using a Weibull probability distribution function.
Distribution shows the relative importance of climate over time (days). (Left) Values of shape, scale and location used as starting parameters for weighted window analysis. (Right) Output from weightwin analysis showing the relative influence of temperature on the average annual laying date of the common chaffinch (Fringilla coelebs). Weight distribution shows that temperature has the strongest influence on laying date immediately before the reference date (April 24th) but slowly decays as we move further into the past. Plots created using the function explore.

