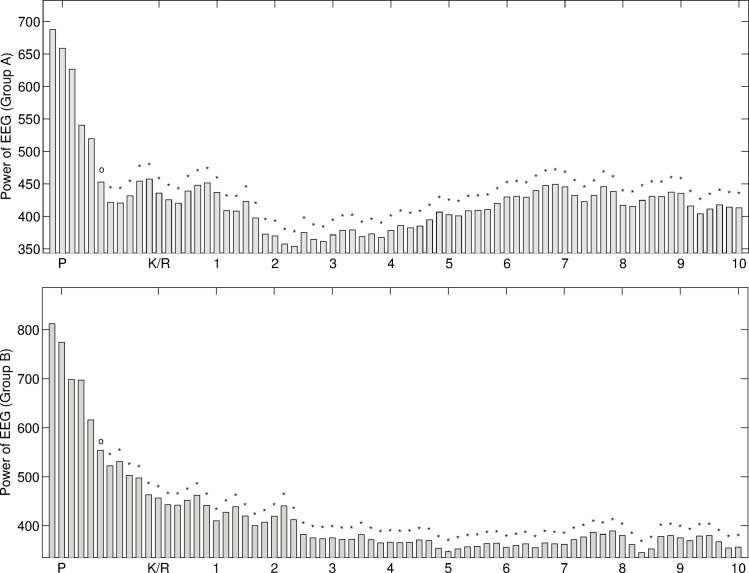
Fig 5. The power of the reconstructed EEG signals using the first 6 IMFs for two groups using Ketamine/Alfentanil.
The time point before the mark of ‘P’ is the baseline; the mark of ‘P’ is the start point of propofol infusion; and the mark of ‘K/R’ is the time point of anesthesia agent injection. The marks of ‘o’ represent the p-value of statistical test in comparison with baseline lower than 0.05, and the marks of ‘*’ represent the p-value lower than 0.01.

