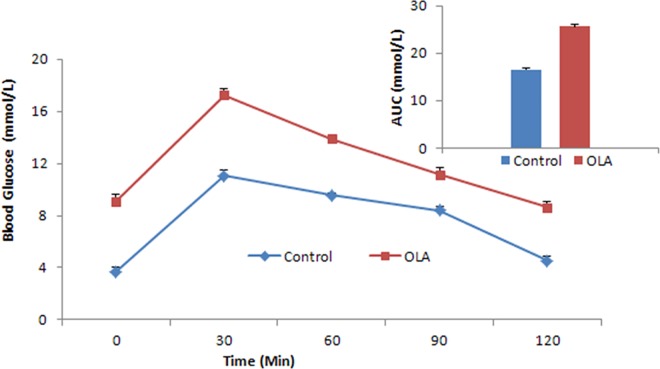
Fig 1. Effects of chronic olanzapine treatment on glucose and AUC(top right) levels in femaleBalb/c mice in the oral glucose tolerance test.
Glucose levels of the OLA group were significantly elevated compared to the control group throughout the OGTT. The AUC of the OLA group was also significantly increased (p<0.001). AUC: area under the curve; OGTT: oral glucose tolerance test. * indicates different from the control group, p<0.001.

