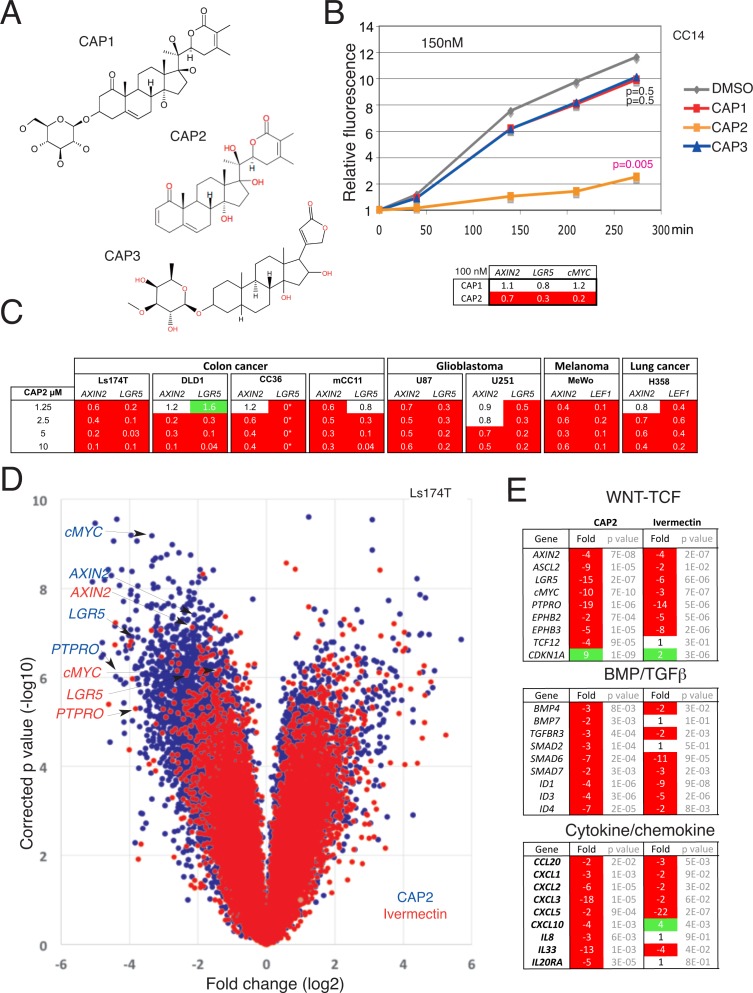
Fig 1. Identification of CAP molecules as WNT-TCF response blockers.
A) Chemical structure of the CAP1, CAP2 and CAP3 steroidal lactone small molecules. B) Changes in relative fluorescence intensity of CC14-GFP+ cells over time. At 0.15μM only CAP2 is effective whereas at 2.5μM CAP1, CAP2 and CAP3 repress increases in fluorescence (see also panel C in S3 Fig), related here to cell state and mass. P values are given for the end points in relation to DMSO-treated controls. The inset shows a heat map with normalized ratios over control highlighting the repression of AXIN2, LGR5 and cMYC by CAP2 but not by CAP1 at 0.1μM. C) Heat maps of the normalized expression levels of different WNT-TCF targets after treatment of multiple colon cancer cells, melanoma, glioblastoma and lung cancer cells with increasing concentrations of CAP2 as noted. LGR5 levels in CAP2-treated CC36 were undetectable (0*). All values are normalized ratios with DMSO-controls, which were equated to 1. All analyses shown in this figure were performed with the third CAP2 batch. D) Scatter (volcano) plot of the changes in gene expression obtained by microarray of Ls174T cells treated with 5μM CAP2 (blue) or 5μM with Ivermectin (red) for 16h in vitro as 2D cultures. Values are over controls and are per probe with the x-axis giving the fold change in log2 scale and the y-axis the corrected p value in log10. The position of four WNT-TCF targets is highlighted. E) Analyses of WNT-TCF, BMP/TGFß and cytokine/chemokine pathway hits identified for CAP2 and ivermectin from the microarray data (D). Change is given in fold (positive or negative) and only reliable _at or _a_at probes are counted. For probe set ID see panel C in S7 Fig.

