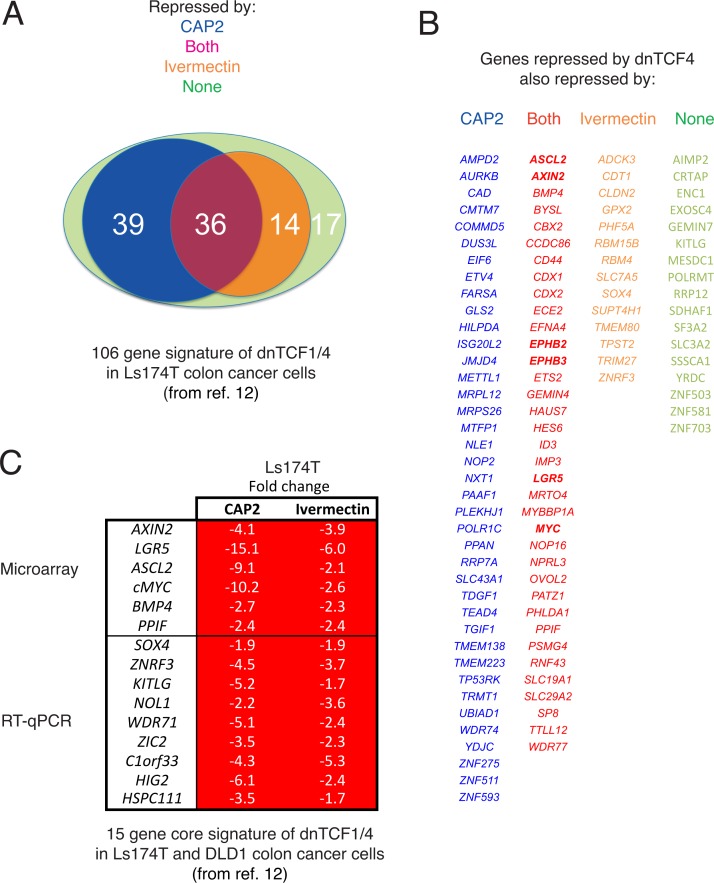
Fig 2. CAP2 and ivermectin regulate a large set of TCF-targets known to be repressed by dnTCF.
A) Venn diagram representation of the overlap of 106 TCF-responsive genes in Ls174T cells [13] with the set repressed by CAP2 (75 genes), ivermectin (50 genes) or both (36 genes). 39 genes are repressed only by CAP2 and not by ivermectin, and 14 by ivermectin and not by CAP2. 17 genes are neither repressed by CAP2 nor ivermectin. B) Color-coded lists of genes in each class shown in (A). C) Heat map of the changes (in fold) observed after CAP2 or ivermectin treatment of Ls174T cells for a core set of 15 genes repressed by dnTCF1/4 in both DLD1 and Ls174T cells from [13]. The upper part is derived from the microarray data and the bottom was directly determined in cells treated as those used for the microarrays by RT-qPCR with specific primers. Whereas both CAP2 and ivermectin repress the entire set each shows gene-specific differences in the extent of the repression. All values are normalized over DMSO-treated controls.

