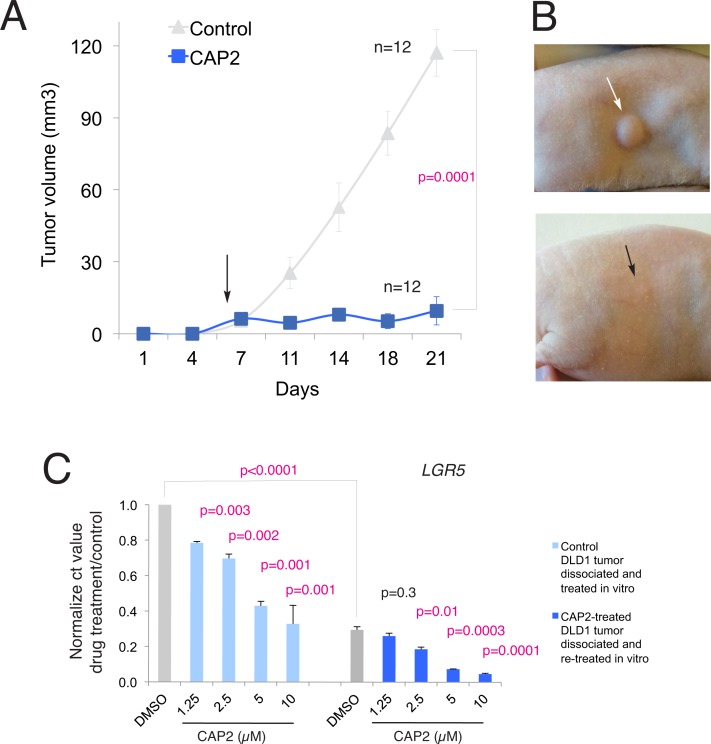
Fig 3. CAP2 inhibits DLD1 human colon cancer xenograft growth.
A) Graph of tumor growth over time measuring tumor volume in control (cyclodextrin alone) DLD1 xenografts in Nude mice versus those receiving cyclodextrin-conjugated CAP2. The p value is given for the endpoint of the experiment noted by the bracket. n = number of tumors. B) Representative image of subcutaneous DLD1 xenograft tumor (arrows) growth seen in control mice (up) and those receiving CAP2 systemically administered via IP (bottom). C) Histograms of the repression of LGR5 mRNA levels by CAP2 treatment in cells derived from control tumors (left) and those previously treated with CAP2 (right), both after dissociation and in vitro treatment for 16h with different concentrations of CAP2. Note the dose-dependent repression of LGR5 levels in relation to the base of controls (gray bars), which are lower in DMSO-treated cells derived from CAP2 treated tumors in vivo than in control cells from control tumors. The level on DMSO-treated cells from control tumors is set to 1 and the other values (light blue for CAP2-treated cells from cyclodextrin only-treated control tumors or darker blue for CAP2-treated cells from CAP2-treated tumors) are set in reference to this. P values are in relation to the respective DMSO-treated controls (gray bars) unless noted by the bracket that shows the P value between in vivo pretreated with CAP2 and non-pretreated DMSO controls (gray bars).

