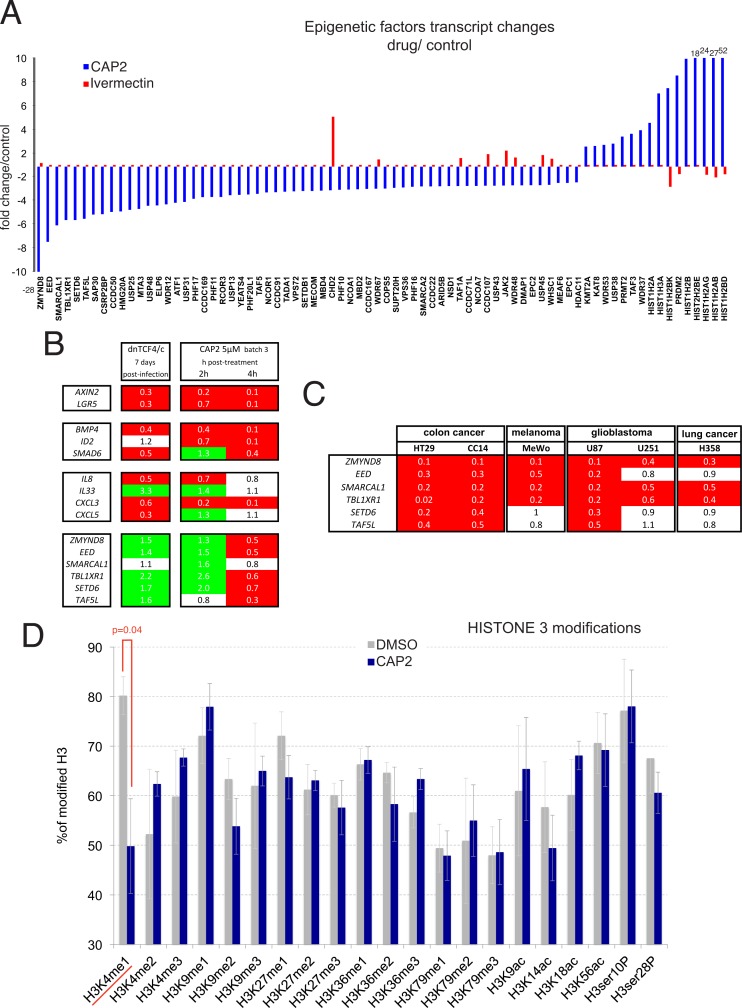
Fig 5. Regulation of chromatin components and remodelers by CAP2.
A) Genomic analysis of transcriptomic changes in Ls174T cells imposed by CAP2 but not by ivermectin on an epigenetic gene set revealed large repression or increases in the levels of chromatin remodelers and components. The x-axis denotes the genes (using only reliable _a or _a_at probes) with the associated fold change in relation with DMSO-treated controls, both for CAP2 (blue) and for ivermectin (red) treatments in the y-axis. Changes off scale are written near the respective column. B) Modulation of selected WNT-TCF, BMP, cytokine/chemokine and epigenetic regulator genes by stable dnTCF expression (left) and after 2 or 4h following CAP2 treatment as indicated (right). C) Heat maps of the changes in gene expression after CAP2 treatment (0.5μM batch 4 for 16h) in different human cancer cells as indicated. All values in the heat maps in (B,C) show normalized ratios over DMSO controls. D) Histogram showing CAP2-driven changes in HISTONE 3 modifications. The average of four assays is shown for control DMSO-only treated Ls174T cells and CAP2-treated sibling cells as described in Materials and Methods. The only significative change (p<0.05) was detected in the levels of monomethylated lysine 4.

