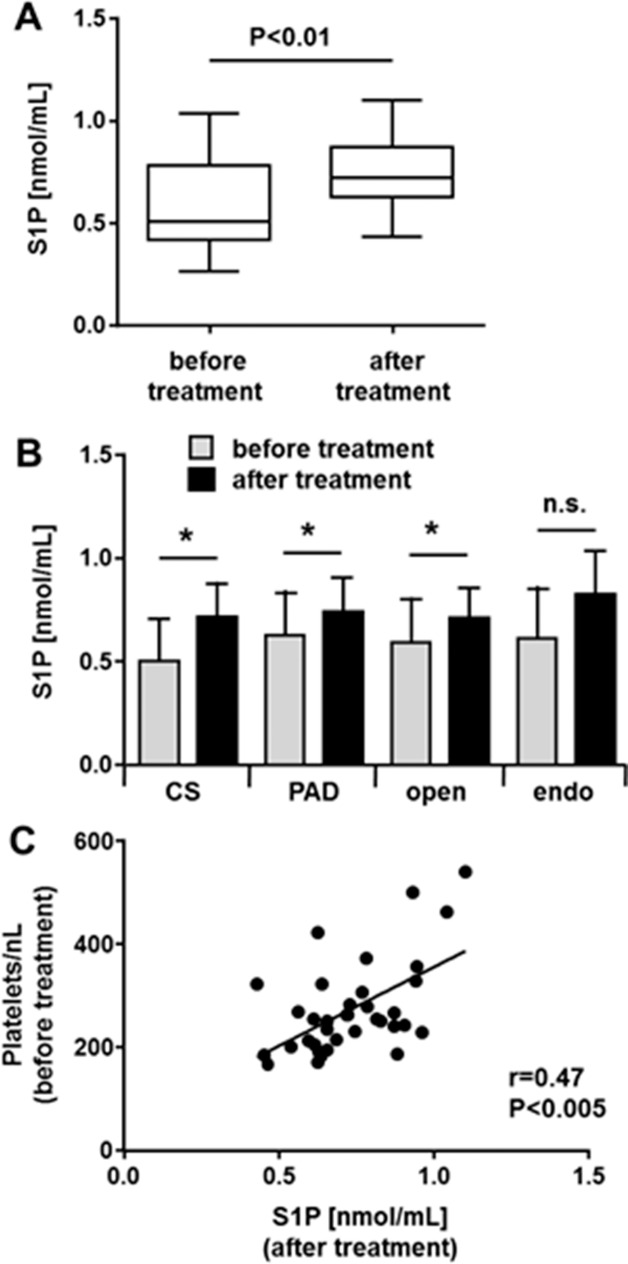
Fig 3. Serum-S1P levels rise after treatment.
Serum-S1P was measured in 35 patients between one and six months after treatment (recovery cohort). A; serum S1P in the recovery cohort (N = 35) was compared before and after treatment to restore blood flow. Data are presented as median with maximum, minimum and 3rd and 1st quartiles. Statistical analysis was performed by two-tailed, paired T-test. B; the recovery cohort was classified into two groups at a time, CS patients (N = 8) and PAD patients (N = 27) or as to the form of treatment (open (N = 28) or endovascular (N = 7)). The serum-S1P concentrations (mean +/- SD) before and after treatment are shown for each group. Statistical analysis was performed by two-tailed T-test. *P<0.05; n.s. = non-significant. C; using data obtained from the recovery cohort, a regression analysis was performed for platelet numbers pre-treatment and serum-S1P in recovery (r = Spearman correlation coefficient).

