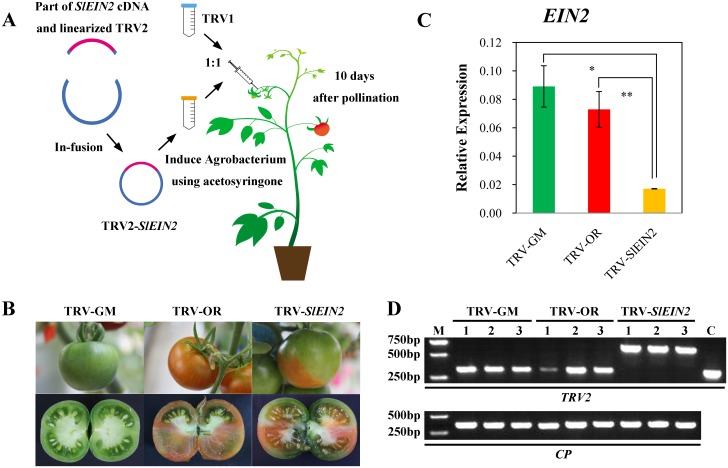
Fig 1. Acquisition of TRV-SlEIN2 fruits.
(A). Main phases of VIGS. (B). Non-ripening phenotype of attached and dissected TRV-SlEIN2 tomato fruit compared with the two control groups. (C). qPCR analysis of SlEIN2 expression in VIGS and control fruits. The error bar indicates the standard deviation, based on three biological replicates. Asterisks indicate significant differences, according to Student’s t-test (***, P < 0.001). (D). pTRV transmission in fruits. M is the 2 kb marker, and C is the control, using the pTRV2 plasmid as template. 1, 2, and 3 represent the three biological replicates.

