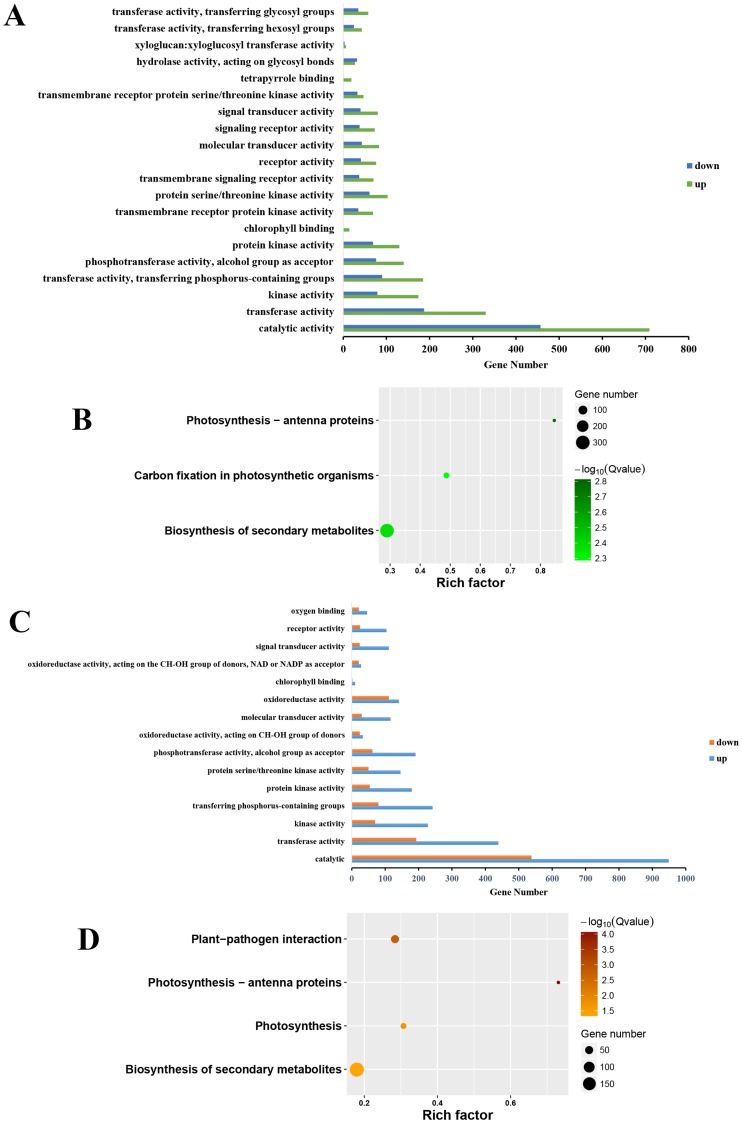
Fig 4. Molecular function and pathway enrichment analysis of SDEGs.
(A). Molecular function of TRV-GM/TRV-SlEIN2 SDEGs, considering a corrected P-value < 0.05. The X axis indicates the gene number, and Y represents classification. (B). Top 3 pathway enrichment of TRV-GM/TRV-SlEIN2 SDEGs, with a Q-value < 0.05. Rich factor means the number of gene from SDEGs/all gene numbers, in a pathway. (C, D). Molecular function and top 4 pathway enrichment of TRV-OR/TRV-SlEIN2 SDEGs. All the graphic descriptions and parameters are identical to TRV-GM/TRV-SlEIN2.

