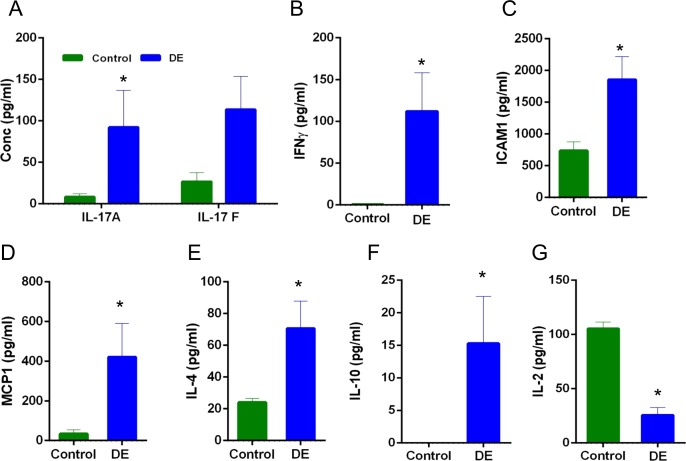
Figure 3.
Altered tear levels of IL-17A/F, IFNγ, ICAM1, MCP1, IL-4, IL-10, and IL-2 in the tears of mild dry eye patients. The graphs indicate the levels of IL-17A/F (A), IFNγ (B), ICAM1 (C), MCP1 (D), IL-4 (E), IL-10 (F), and IL-2 (G) quantified by cytometric bead array in the tears of control (n = 10) and dry eye patients (n = 13). Bar graphs indicate mean ± SEM.*P < 0.05.

