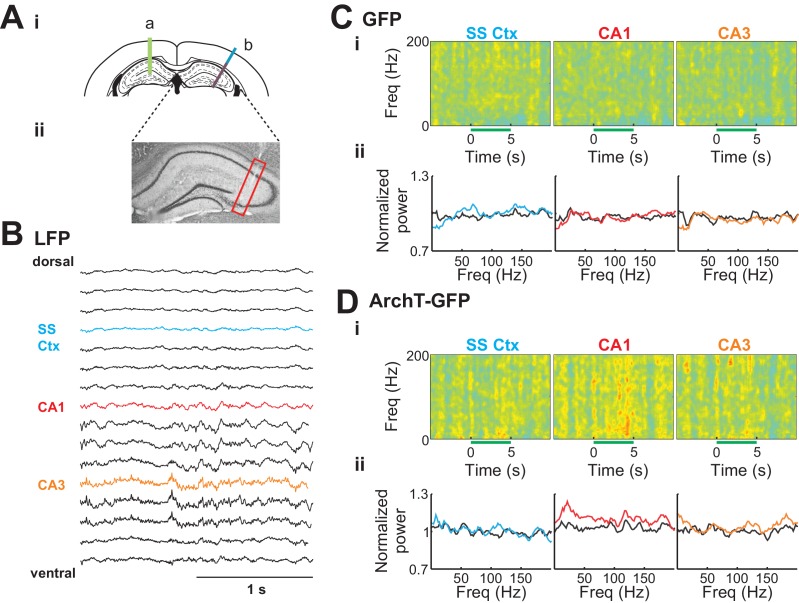
Figure 5. Silencing of young abDGCs led to LFP changes in the contralateral CA1 region.
(Ai) Experimental set up illustrating an optical fiber (green line, a) positioned in the DG where abDGCs were virally labeled, and a 16-channel electrode probe (b) in the contralateral hippocampus at a 30 degree angle. (Aii) A representative histological image showing the position of the electrode track in the hippocampus (highlighted with the red box). Cell bodies were labeled with Nissl straining. (B) Example LFPs recorded from each of the 16 electrode contacts from the brain surface to the CA3. (C) (D) Normalized spectrograms of the LFPs recorded in a control MSCV-GFP virus injected mouse (Ci) and in a MSCV-ArchT-GFP virus injected mouse (Di), and the averaged LFP powers (Cii, and Dii) before (black trace), and during light stimulation in the cortex (blue), the CA1 (red), and the CA3 (orange).

