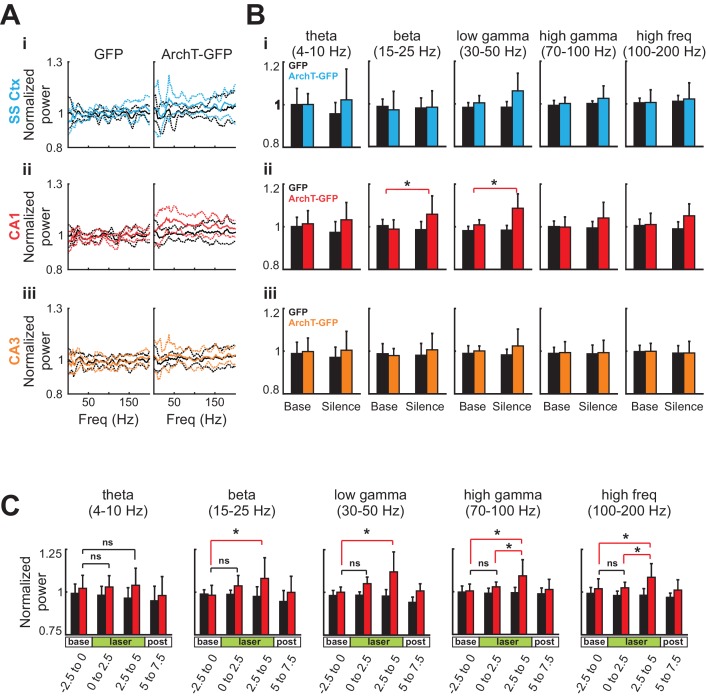
Figure 6. Silencing of young abDGCs produces a slow and gradual increase in LFP power across several frequency bands localized to CA1.
(A) The average normalized power of LFP at different frequencies during the baseline period (black) and during light stimulation in the somatosensory cortex (Ai:blue), the CA1 (Aii:red), and the CA3 (Aiii:orange) in the GFP group (N = 5 mice) and the ArchT-GFP group (N = 8 mice). The solid lines indicate the mean, and the dashed lines are mean ± S.D. (B) Averaged LFP powers at various frequency ranges before and during light stimulation. Light stimulation increased LFP power significantly at beta (15–25 Hz) and low gamma (30–50 Hz) ranges, but only in the CA1 region (Aii:red). Beta: t1,7 = 3.43, p=0.01; low gamma: t1,7 = 3.91, p<0.01; high gamma: t1,7 = 1.97, p=0.09; high frequency: t1,7 = 2.12, p=0.07: (*p<0.05). Error bars are standard deviation (S.D.). (C) Averaged LFP power across frequency bands for CA1 before, during, and following optogenetic silencing. Light stimulation produced no significant increases in LFP power in the first 2.5 s of stimulation (ns). Significant increases in LFP power were present in the final 2.5 s of silencing at beta (15–25 Hz) low gamma (30–50 Hz), high gamma, (70–100 Hz), and high frequency (100–200 Hz) ranges: Beta: t1,7 = 3.16, p=0.01; low gamma: t1,7 = 2.90, p=0.02; high gamma: t1,7 = 2.47, p=0.04; and high frequency: t1,7 = 2.78, p=0.03: p<0.05, ns = non-significant. Error bars are standard deviation (S.D.).

