. 2016 Nov 23;5:e20148. doi: 10.7554/eLife.20148

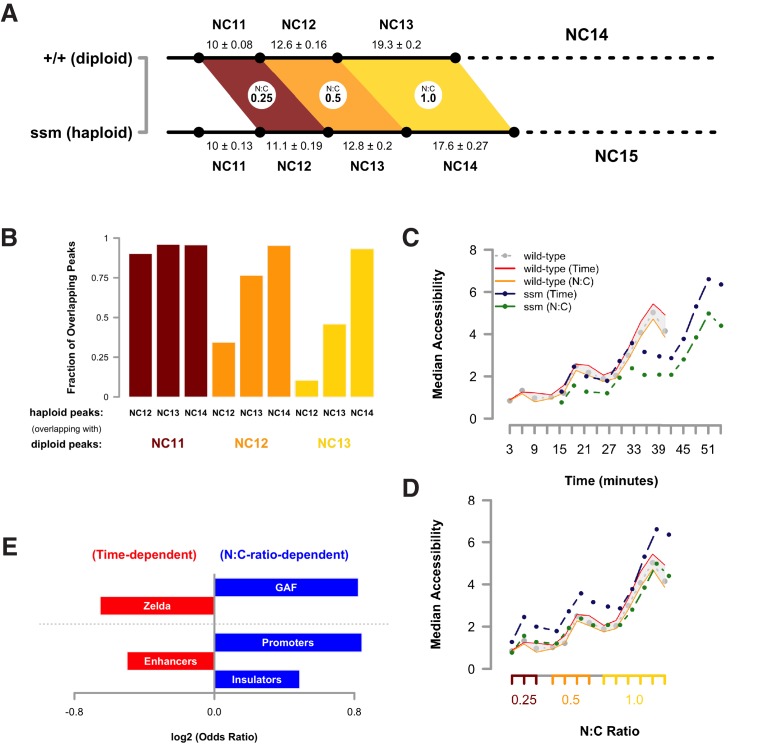
Figure 2. Dynamic acquisition of chromatin accessibility is regulated by the N:C ratio.

(A) Cell cycle times for diploid (+/+, n = 21) and haploid embryos (ssm, n = 12) were measured by time lapse confocal imaging of His2Av-GFP. Mean cell cycle times ± SEM are indicated. Colored regions indicate periods of equivalent N:C ratios (0.25–1.0) between genotypes. (B) Accessible peaks were identified for haploid embryos and the fraction of overlap or co-occurence between diploids and haploids was calculated and plotted for the indicated cell cycles. (C) Median accessibility for haploid and diploid embryos was calculated for the sets of regions indicated in the legend (n = 2630 N:C ratio dependent regions, n = 1658 time-dependent regions). All differences in magnitude between time- and N:C ratio-dependent peaks in haploid embryos are statistically significant at p<0.01 by a randomization test, whereas only the NC13 + 15’ time point achieves p<0.01 in the diploid dataset. Significance testing performed by proportionally dividing all datapoints into two groups at random and testing whether observed differences in median accessibility were equal to or greater than the difference observed between the ‘N:C ratio’ and ‘time’ groupings (one-tailed permutation test for n = 1×10⁴ trials). (D) Median accessibility data from panel C was re-scaled along the x-axis to match relative N:C ratios as shown in panel A. (E) Odds ratios for enrichment of the indicated genomic features and transcriptional regulators were calculated. Time-dependent chromatin accessibility is enriched for enhancers (p=5.78x10⁻⁷) and Zelda binding (p=2.42x10⁻¹²), whereas N:C ratio dependent chromatin accessibility is enriched for promoters (p=5.66x10⁻¹⁷), insulators (p=2.42x10⁻⁴), and GAF binding (p=2.72x10−09). p-Values are from two-sided Fisher’s exact test on contingency tables constructed on [-/+ feature by time/N:C]. GAF odds ratios were calculated from regions that were GAF+ and Zelda-. GAF is significantly enriched in both N:C and time-dependent classes if co-occurrence with Zelda is considered.

DOI: http://dx.doi.org/10.7554/eLife.20148.029

Figure 2.

Figure 2—figure supplement 1. Examples of N:C-ratio-dependent regions.

Figure 2—figure supplement 1.

Each plot shows the accessibility profiles over time for diploid (left, blue, NC11 to NC13) and haploid (right, green, NC12 to NC14) samples at four regions selected on the basis of the distribution of open ATAC-seq coverage within the total set of N:C-ratio-dependent peaks. The y-axis shows coverage of open ATAC-seq reads at an equal scale for all eight plots. The x-axis shows a 10 kb region centered over the peak region of interest (arrow, coordinates provided at top of plots). The gene models mapping to the displayed region are shown at bottom (yellow). An N:C-ratio-dependent region is expected to gain accessibility at equivalent nucleo-cytoplasmic ratios, not equivalent nuclear cycles. The timecourses for diploid and haploid samples are aligned by equivalent nucleo-cytoplasmic ratios. As such, it is expected that N:C-ratio-dependent peaks show equivalent accessibility horizontally across the plots. Certain loci (e.g., tinman) gain accessibility one timepoint earlier in haploids than diploids. Our analysis was not designed to distinguish single-timepoint shifts in the onset of accessibility. Rather, our analysis focused on changes in accessibility from samples pooled by entire nuclear cycles/N:C ratios.

Figure 2—figure supplement 2. Examples of regions that gain accessibility independently of the N:C ratio.

Figure 2—figure supplement 2.

Each plot shows the accessibility profiles over time for diploid (left, blue, NC11 to NC13) and haploid (right, green, NC12 to NC14) samples at four regions selected on the basis of the distribution of open ATAC-seq coverage within the total set of N:C-ratio-independent peaks. The y-axis shows coverage of open ATAC-seq reads at an equal scale for all eight plots. The x-axis shows a 10 kb region centered over the peak region of interest (arrow, coordinates provided at top of plots). The gene models mapping to the displayed region are shown at bottom (yellow). An N:C-ratio-independent region is expected to gain accessibility at equivalent nuclear cycles, not equivalent nucleo-cytoplasmic ratios. The timecourses for diploid and haploid samples are aligned by equivalent nucleo-cytoplasmic ratios. As such, it is expected that N:C-ratio-independent peaks show greater accessibility earlier (higher up on the plots) in haploids compared with diploids.