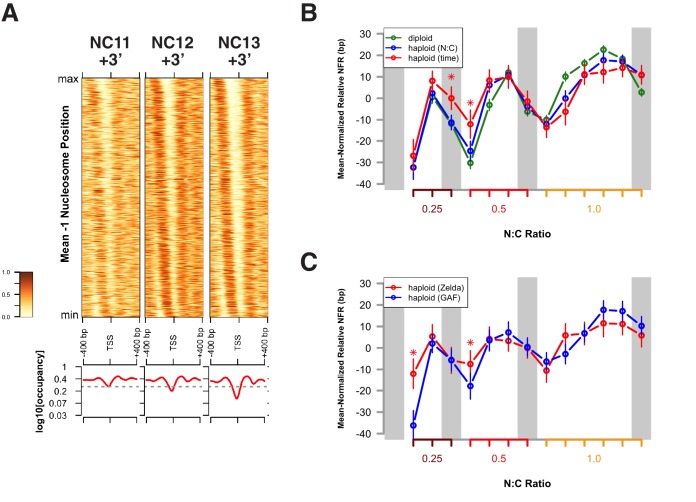
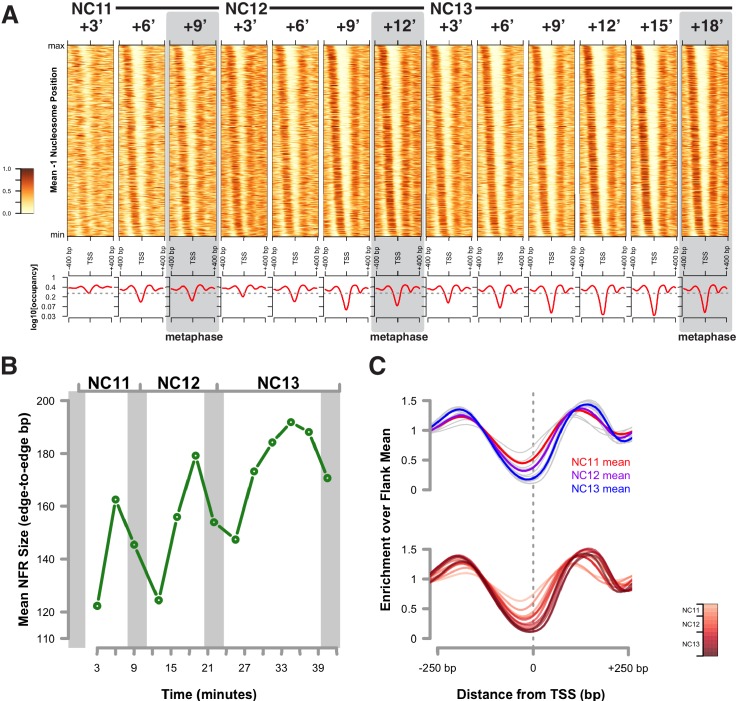
Figure 4. Attenuation of replication coupled nucleosome disruption at the MBT.
(A) Predicted nucleosome occupancy is plotted for the selected time points (top) for the 800 bp region flanking a set of early embryonic promoters, centered over the TSS. These timepoints correspond to the initial phases of DNA replication in each cell cycle. Nucleosome profiles for the complete timecourse are provided in Figure 4—figure supplement 1. Promoters are ordered on the y-axis by the average −1 nucleosome position over the entire time course, and the relative nucleosome occupancy is represented by the colorbar at left. The log10 average occupancy signal for each time point is plotted below each heatmap (red). Maximum nucleosome signal at the TSS over the entire timecourse is indicated by the grey line. (B) Mean-normalized relative NFR sizes for time (red) and N:C ratio (blue) dependent loci are plotted for haploid embryos for comparison with diploid embryos (green). Data are plotted as a function of N:C ratio (x-axis). NFRs for time-dependent loci demonstrate minimal closing during metaphase (N:C = 0.25, p<0.01, asterisk) and early S-phase (N:C = 0.5, p<0.01, asterisk) compared with N:C-ratio-dependent loci and N:C ratio matched diploid loci. p-Values indicate frequencies of observing differences between randomly selected loci greater than or equal to that observed for the time- and N:C-ratio-dependent groups (one-tailed permutation test for n = 1×10⁴ trials). Error bars show the 95% confidence interval for differences between the plotted median values. (C) Mean-normalized relative NFR sizes for Zelda-associated (red) and GAF-associated (blue) promoters was plotted for haploid embryos. Plotting and significance testing is as described for panel B. Zelda-associated promoters demonstrate increased NFR stability during early S-phase during both N:C = 0.25 and N:C = 0.5 (asterisks, p<0.01, one-tailed permutation test for n = 1×10⁴ trials). Error bars show the 95% confidence interval for differences between the plotted median values.


