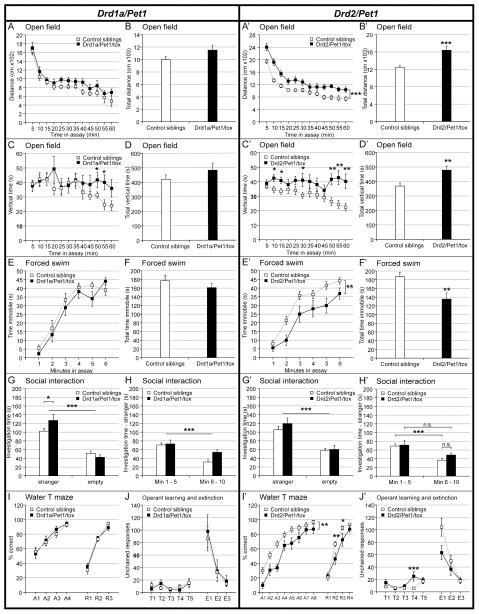
Figure 3. Behavioral phenotyping of Drd1a/Pet1- and Drd2/Pet1-silenced mice.
All values shown are mean ± SEM. Complete statistical measures are provided in Tables S4 (Drd1a/Pet1) and S5 (Drd2/Pet1).
A/A′ – D/D′) Open field. Horizontal distance traveled during a 60 min. open field assay is shown in 5 min. bins (A/A′) and as total distance traveled (B/B′). Time spent in vertical exploration is shown in 5 min. bins (C/C′) and as total vertical exploration time (D/D′).
E/E′ and F/F′) Forced Swim. Average time spent immobile during each minute of the forced swim test (E/E′) and the total time spent immobile (F/F′).
G/G′ and H/H′) Three chamber social interaction. Average time spent investigating the perforated container holding a stranger mouse (under perforated cup) or investigating an empty perforated container during the three-chamber social interaction assay. (H/H′) shows the average time spent at the container with the stranger mouse binned into first and second halves of the assay.
I/I′) Water T-Maze. The graphs plot the % of correct arm choices during acquisition and reversal learning phases for Drd1a/Pet1-silenced (I), Drd2/Pet1-silenced (I′), and control mice.
J/J′) Operant learning task. The graphs plot the number of unchained responses, lever presses in the absence of stimuli, during training and extinction phases for the Drd1a/Pet1-silenced (J), Drd2/Pet1-silenced (J′), and control mice.

