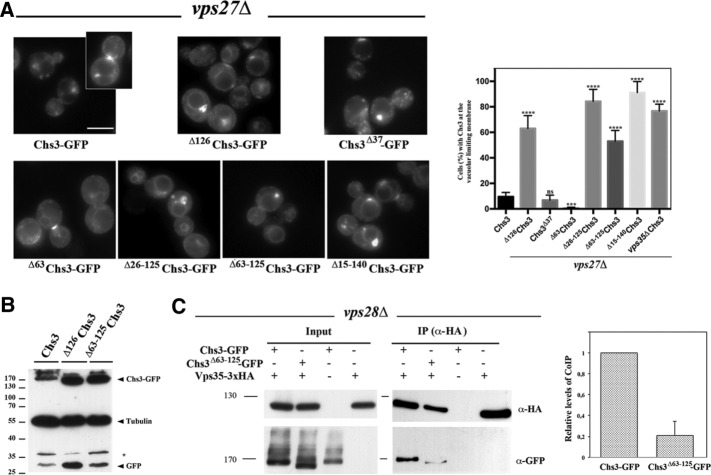
FIGURE 2:
The role of the N- and C-terminal regions of Chs3 in its trafficking through the LE pathway. (A) Localization of the indicated forms of Chs3-GFP in the vps27Δ mutant. In this strain, the different forms of Chs3 accumulate in the class E compartment and the vacuolar space is clear in all cases, but only some of the constructs stain the vacuolar limiting membrane. The graph represents the percentage of cells showing vacuolar membrane staining for each construct, including the numerical value for Chs3 in the double mutant vps27Δ vps35Δ. Note the absence of this signal for wild-type, Δ63Chs3, and Chs3Δ37 proteins. (B) Western blot showing the amounts of Chs3-GFP and tubulin for the indicated constructs. Note that the band corresponding to the vacuolar free form of GFP increased for proteins lacking the N-terminal domain. (C) CoIP assay after DSP cross-linking, showing Vps35/Chs3 interaction in the ESCRT mutant vps28Δ. Vps35 was immunoprecipitated with the anti-HA antibody, and the precipitate was developed with the anti-HA or anti-GFP as indicated. Note the significant levels of coIP between Chs3 and Vps35 proteins but the reduced coIP levels between Vps35 and Δ63-126Chs3. Quantitative analysis of the CoIP is presented in the graph representing the relative amounts of coimmunoprecipitated protein compared with the immunoprecipitated bait. The data included represent the average of four independent experiments.

