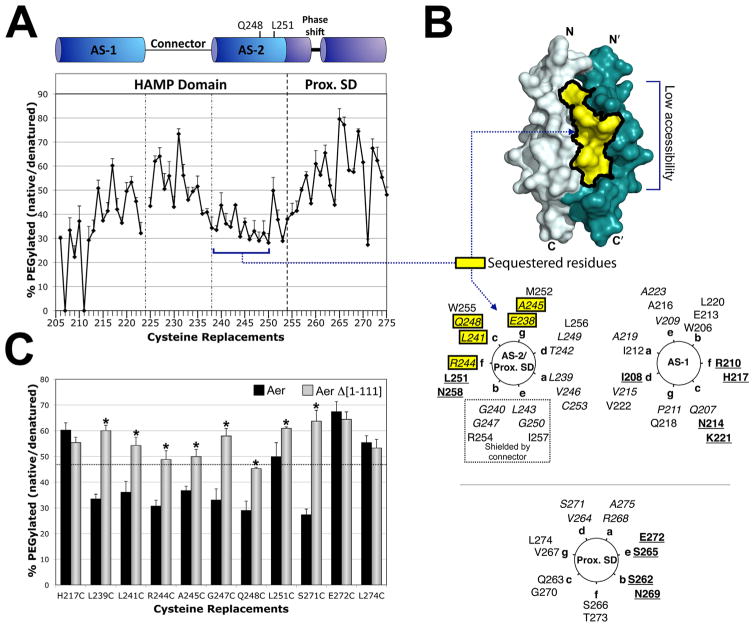
Fig. 3. Accessibility of residues in the HAMP and proximal signalling domains as inferred from reactivity with PEG-mal.
A. Extent of PEGylation for substituted cysteines at each residue of the Aer HAMP and proximal signalling domains. Error bars represent the standard deviation from multiple experiments.
B. Sequestered AS-2 surface residues mapped onto a HAMP dimer model and a helical wheel. The hidden region was inferred by low accessibility to PEG-mal (A), and included residues 238–250 (shaded yellow). Helical wheels use the standard heptad repeat nomenclature (see Fig. 1), and include HAMP AS-1 (right panel), AS-2 (left panel) and the proximal signalling domain (Prox. SD). The proximal signalling domain is divided between two helical wheels due to the presence of a helical phase shift after residue 259, and the resumption of a helical accessibility pattern (with maximum accessibility every third and forth residue), at residue 262 (Watts et al., 2008). AS-2 residues that are shielded by the connector in the HAMP model are indicated within a dotted box. Colour code: bold and underlined, the most accessible residues in each region; italicized, the least accessible residues in each region; yellow boxes, residues predicted to be accessible but found to have low accessibility.
C. Accessibility of HAMP and proximal signalling domain residues in the presence (black bars, full length Aer) and absence (grey bars, PAS-less Aer Δ[1-111]) of the Aer-PAS domain. Error bars represent standard deviations from multiple experiments. Asterisks indicate statistically significant differences in the absence of the PAS domain (P <0.05). The dotted line indicates the average accessibility of exposed AS-1 residues (the underlined residues in the AS-1 helical wheel shown in B).

