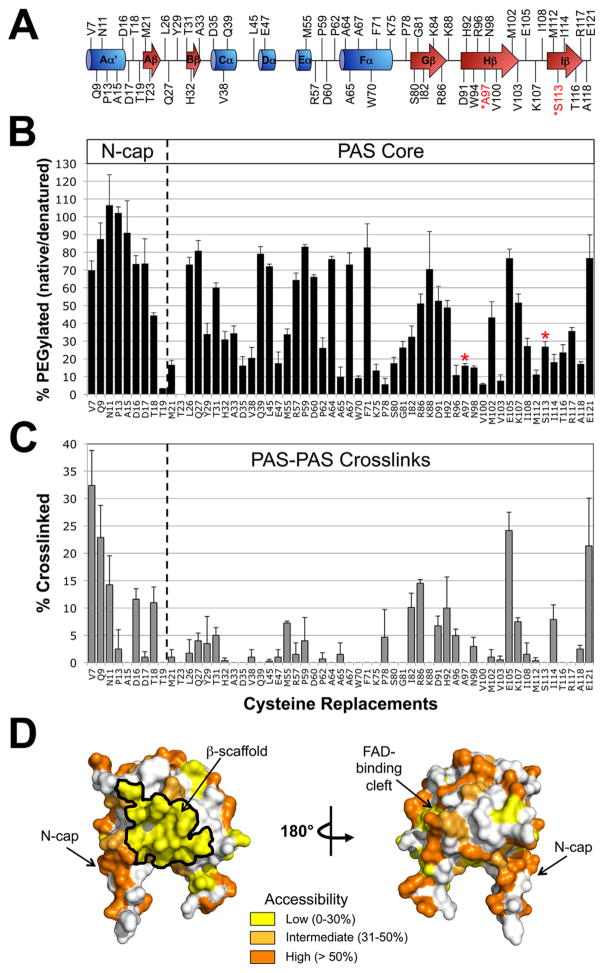
Fig. 4. Probing the PAS domain for solvent accessibility and PAS-PAS proximity using PEGylation and disulfide crosslinking.
A. Residues selected for cysteine replacement mapped onto the secondary structure of the Aer PAS domain. Residues in black font are predicted to be accessible on the surface of the Aer-PAS homology model; those in red font are predicted to face inwards towards the PAS interior, and were selected as surface-inaccessible controls.
B. Extent of PEGylation for substituted cysteines in the Aer PAS core and N-terminal cap (N-cap). Red asterisks identify the surface-inaccessible controls.
C. Extent of disulfide crosslinking between neighboring PAS domains. Error bars in B and C represent the standard deviation from multiple experiments.
D. Aer-PAS homology model showing the distribution of the tested residues based on whether they had low (yellow shading, 0–30% PEGylation), intermediate (light orange, 31–50% PEGylation) or high (orange, >50% PEGylation) accessibility.

