Figure 1.
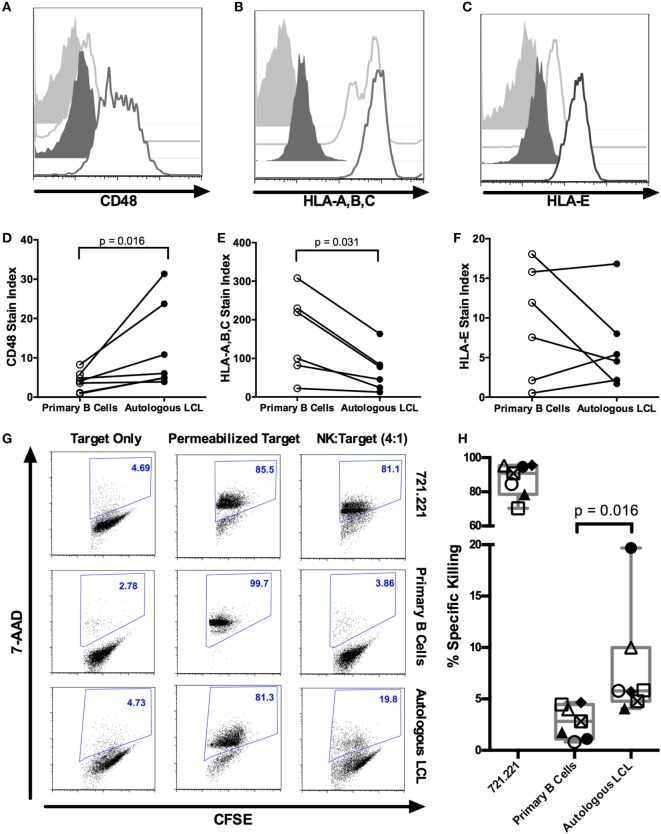
NK cells kill autologous EBV+ LCL. (A–F) Expression of NK ligands CD48, HLA-A,B,C, and HLA-E on autologous CD19+ B cells and EBV+ LCL. (A–C) Representative flow cytometry shows isotype (light gray shaded) or NK ligand-stained (light gray outline) primary CD19+ B cells or isotype (dark gray shaded) or NK ligand-stained (dark gray outline) autologous LCLs. (D–F) Stain indices (34) of N = 6 donors. (G) NK killing of CFSE-labeled target cells (721.221, primary B cells and autologous LCL target cells). The percentage of dead target cells, as detected by 7-AAD and CFSE, are shown in representative samples. (H) Specific killing was calculated as described in Section “Materials and Methods.” Each of the N = 7 donors is labeled with a unique symbol. Error bars represent the minimum and maximum values for each condition. All p-values were calculated using the Wilcoxon matched-pairs signed rank test.

