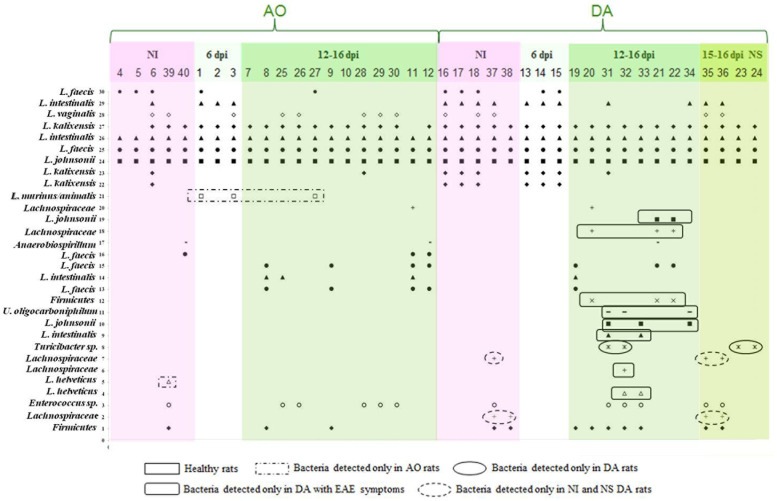
FIGURE 2.
The identity of the rDNA clones obtained from DGGE bands related to the rats and the period of EAE induction. The numbers on the y-axis (1–30) correlate with the numbers of the bands excised, cloned, and sequenced, while the numbers on the x-axis correspond to the numbers of lanes as presented in Figure 1. Each lane represents sample of an individual rat. Total of 40 samples (20 from each of the strains) was analyzed. Five samples were collected before the immunization (non-immunized rats – NI), three samples were collected at 6 d.p.i., and 12 samples were collected at 12–16 d.p.i., from each of the strains. There were four samples of DA rats that had no clinical symptoms of EAE (NS).

