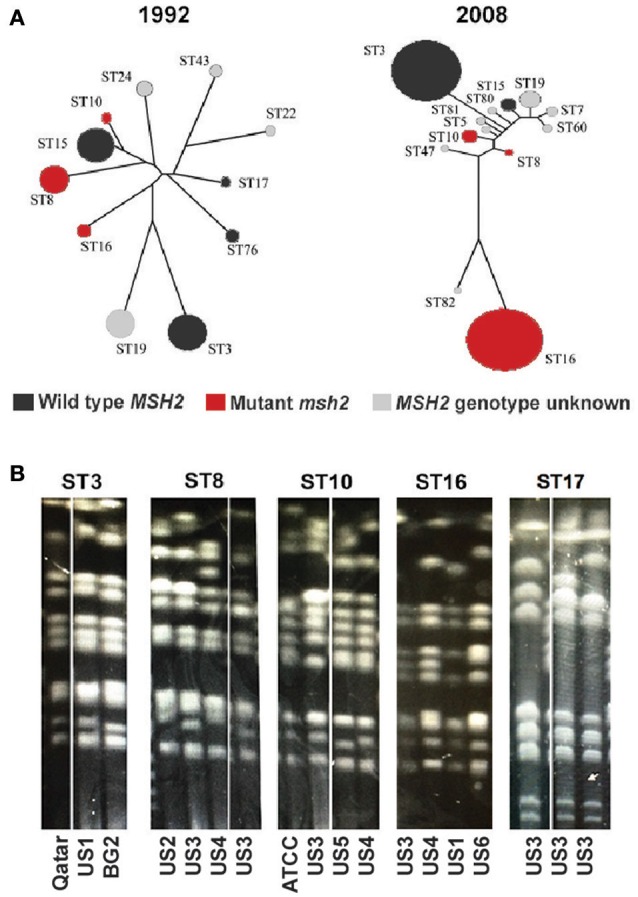
Figure 2.

Temporal changes and chromosomal patterns associated with C. glabrata strain type. (A) The population structure of C. glabrata isolates obtained from candidemia patients in Atlanta hospitals during the indicated years. Each circle represents a particular ST and the msh2 profile of each ST is indicated by color (adapted from Lott et al., 2010). (B) Strains belonging to the same ST have similar chromosome patterns as determined by pulse field gel electrophoresis (PFGE). Chromosome configurations for strains of five different STs are shown and the origins of every clinical isolate are indicated below. Laboratory strains (BG2 and ATCC) or isolates recovered from individual patients at six separate U.S. medical centers (US1-6) or a medical center in Qatar were analyzed.
