
FIGURE 1.
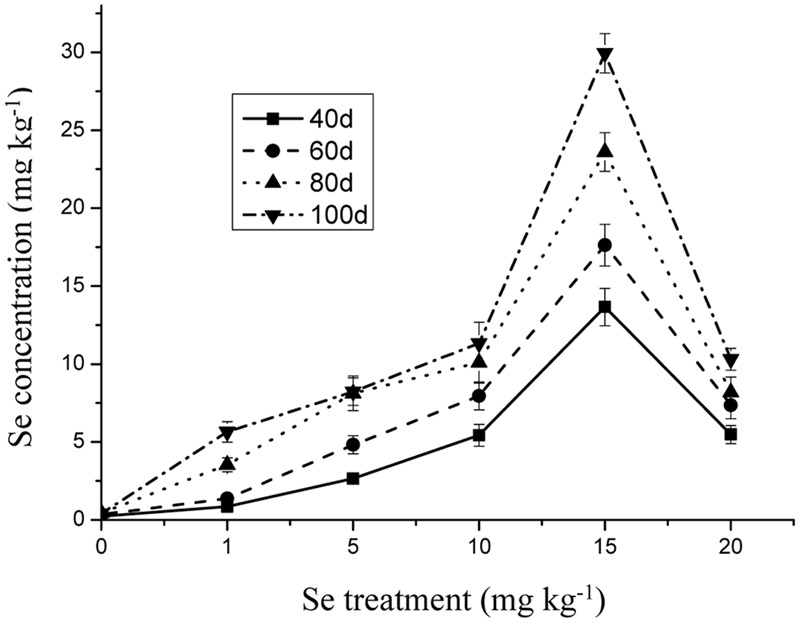
Concentration of Se in shoots of oilseed rape treated with soil Se in different periods. Average concentrations (Dry biomass weight, DBW) provided with error bars representing the standard error. (p ≤ 0.05).
Official websites use .gov
A
.gov website belongs to an official
government organization in the United States.
Secure .gov websites use HTTPS
A lock (
) or https:// means you've safely
connected to the .gov website. Share sensitive
information only on official, secure websites.
Concentration of Se in shoots of oilseed rape treated with soil Se in different periods. Average concentrations (Dry biomass weight, DBW) provided with error bars representing the standard error. (p ≤ 0.05).