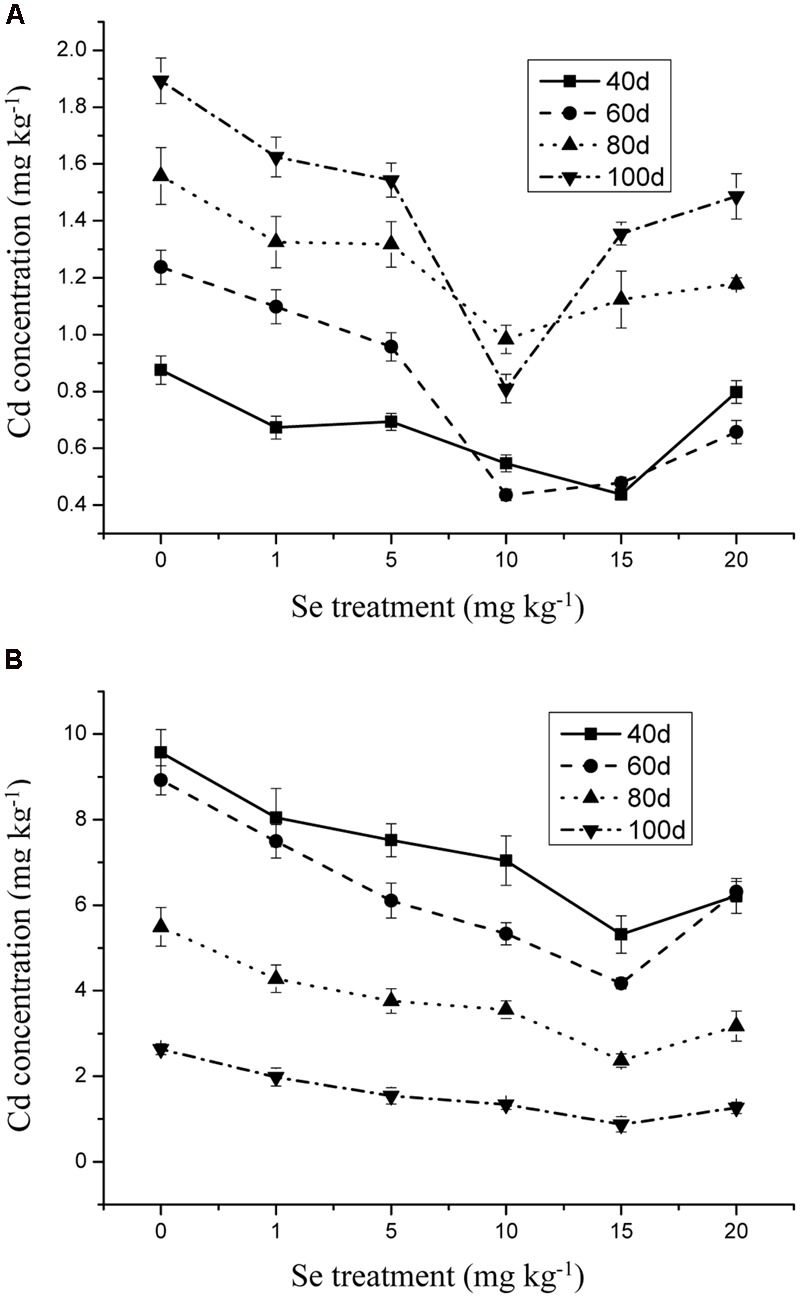
FIGURE 3.

(A) Concentration of Cd in shoots of oilseed rape treated with soil Se and 1 mg kg-1 Cd in different periods. (B) Concentration of Cd in shoots of oilseed rape treated with soil Se and 5 mg kg-1 Cd in different periods. Average concentrations (Dry biomass weight, DBW) provided with error bars representing the standard error. (p ≤ 0.05).
