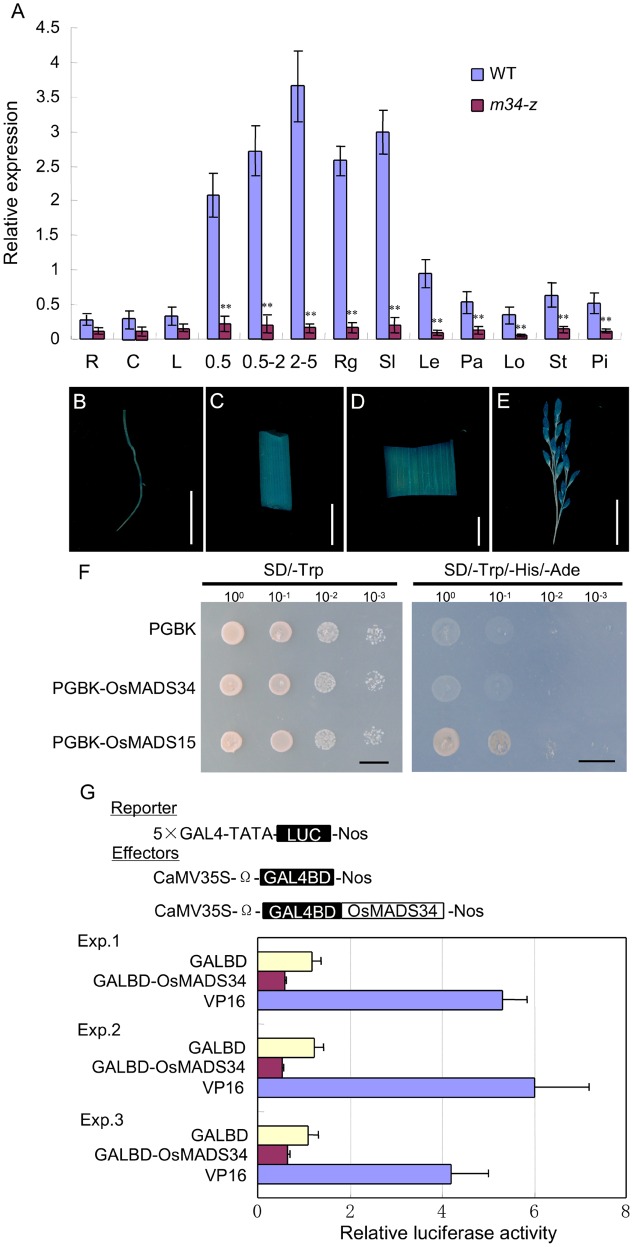
FIGURE 9.
Expression patterns and transcriptional activity analysis. (A) OsMADS34 expression in different tissues detected by qPCR. (B) GUS staining of root. (C) GUS staining of culm. (D) GUS staining of leaf. (E) GUS staining of spikelet. (F,G) Transcriptional activity test. R, root; C, culm; L, leaf; Rg, rudimentary glume; Sl, sterile lemma; Le, lemma; Pa, palea; Lo, lodicule; st, stamen; pi, pistil; 0.5 cm, young panicles (≤0.5 cm); 0.5–2 cm, young panicles (0.5–2 cm); 2–5 cm, young panicles (2–5 cm); 1D, 1 day after pollination; 4D, 4 days after pollination; 7D, 7 days after pollination; 10D, 10 days after pollination. Bars = 1 cm in (B–G). Error bars indicate SD. ∗∗Significant difference at P < 0.01 compared with the wild-type by Student’s test.

