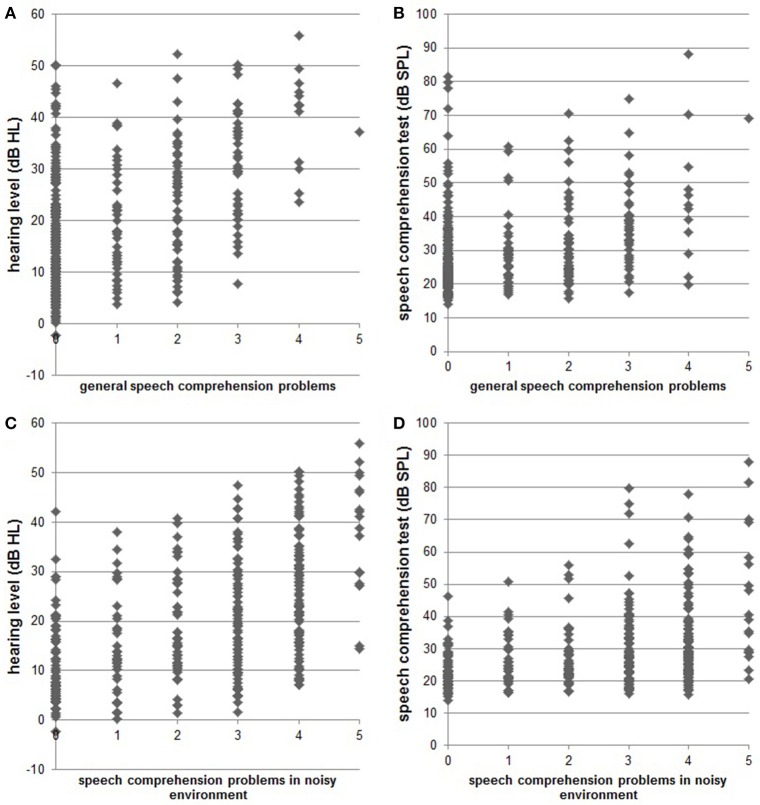
Figure 2.
Scatter plots indicate single subject data for hearing status [pure tone audiogram; (A): r = 0.474; (C): r = 0.517] and speech comprehension status [results from Goettingen sentence test; (B): r = 0.351, (D): r = 0.387] compared to the subjective speech comprehension report in quiet and in noisy environments, respectively.

