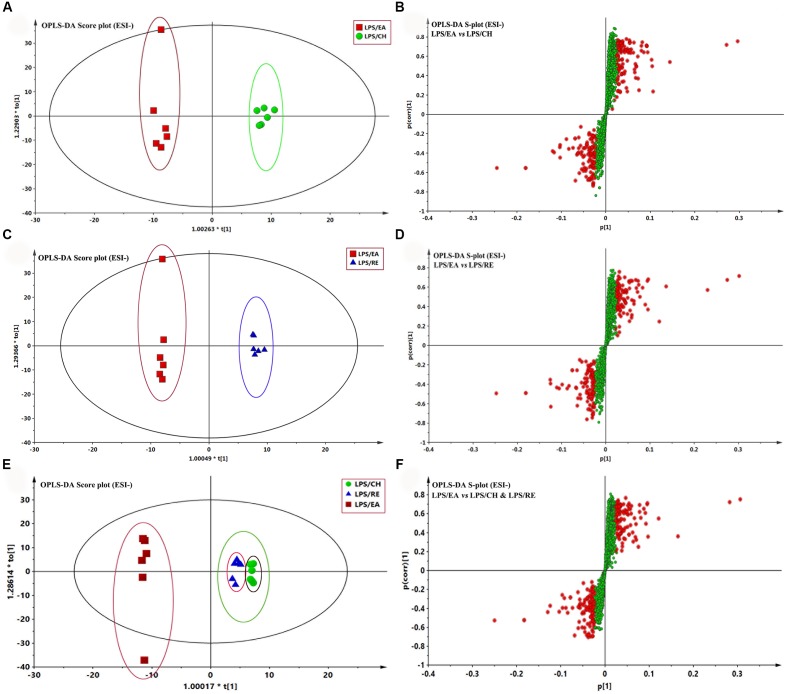
FIGURE 4.
Orthogonal partial least squares-discriminant analysis (OPLS-DA) analysis of the data generated from the ESI- mode. S-score plots constructed from the supervised OPLS analysis of serum (B,D,F), the axes that are plotted in the S-plot from the predictive component are p1 vs. p(corr)1, representing the magnitude and reliability, respectively. Metabolite ions with variable influence on the projection (VIP) value >1 were marked with a red square. (A,B) Displays the result of OPLS-DA model using the data from the LPS/EA and LPS/CH groups in ESI- mode. (C,D) Displays the result of OPLS-DA modelusing the data from the LPS/EA and LPS/RE groups in ESI- mode. (E,F) Displays the result of OPLS-DA model using the data from the LPS/EA, LPS/CH and LPS/RE groups in ESI- mode.

