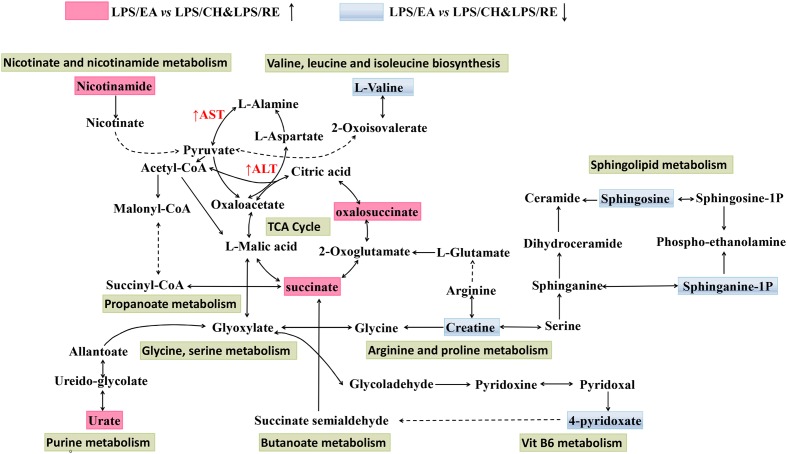
FIGURE 5.
Schematic diagram of the disturbed metabolic pathway related to LPS/EA treatment. The notations are as follows: (↑) in red, metabolite higher in LPS/EA treated group than in LPS/CH and LPS/RE groups; (↓) in green, metabolite lower in LPS/EA treated group than in PS/CH and LPS/RE groups. The related metabolic pathways are cycled in a black box; ALT, glutamate pyruvate transaminase; AST, aspartate aminotransferase.

