Figure 7.

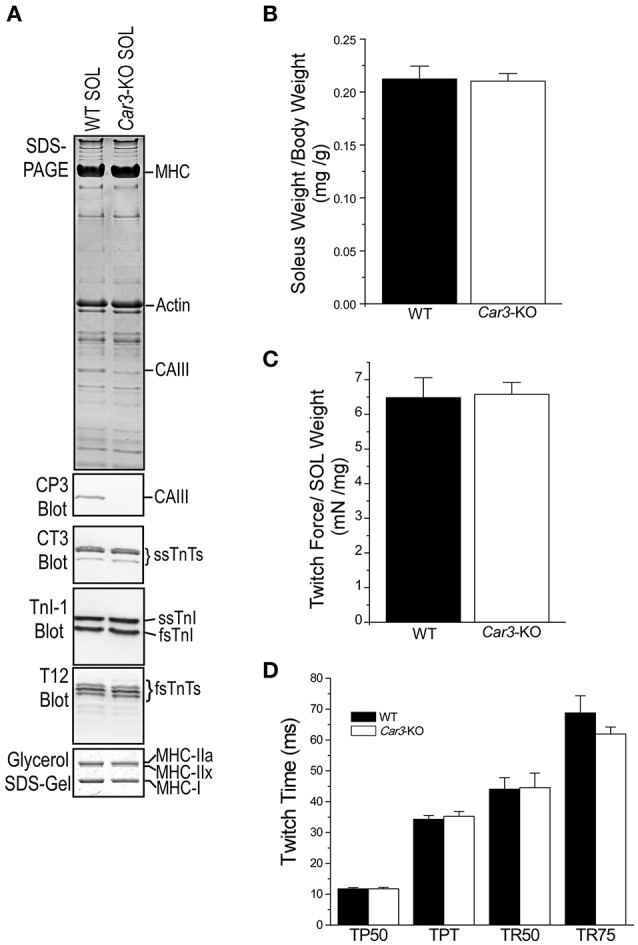
Similar expression of myofilament protein isoforms, total mass and contractility of Car3-KO and WT mouse soleus muscle. (A) SDS-PAGE, Western blots and glycerol-SDS-gel showed no difference between Car3-KO and WT mouse soleus muscles in the overall protein profiles and the expression of troponin and MHC isoforms. (B) No difference was found in the soleus muscle weight to body weight ratio between Car3-KO and WT mice. (C) Twitch force of superfused soleus muscle normalized to muscle weight was similar in Car3-KO and WT groups. (D) Car3-KO and WT soleus muscles showed similar time parameters of twitch contraction and relaxation (TP50, time to develop 50% peak force; TPT, time to develop peak force; TR50, time for 50% relaxation; and TR75, time to 75% relaxation). The data are presented as mean ± SE. N = 6 mice each in WT and Car3-KO groups. Statistics analysis was performed using Student's t-test.
