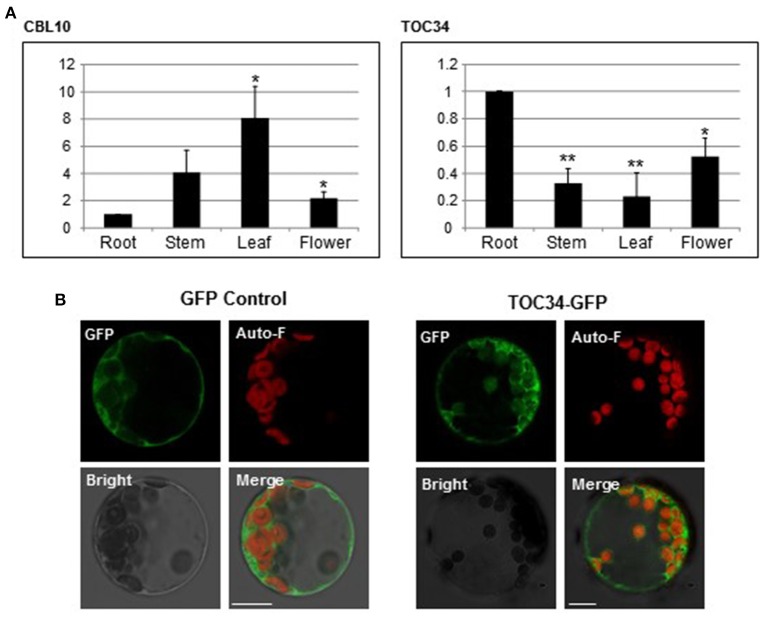
Figure 6.
Expression patterns of TOC34 and subcellular localization of TOC34. (A) Expression patterns of TOC34 and CBL10 using qRT-PCR analysis. The expression levels of TOC34 and CBL10 in roots were set to 1.0 to show relative abundance differences. Actin2 gene was employed as an internal control. Error bars denote standard deviation (SD) of three technical replicates. Significance was calculated using the Student's t-test: *P < 0.05, **P < 0.01. (B) Localization pattern of TOC34. Arabidopsis protoplasts were transfected with 35S::GFP (left two columns) or 35S::TOC3-GFP (right two columns), and GFP fluorescence was examined. GFP, Auto-F, Bright, and Merge indicate GFP fluorescence signal, auto-fluorescence signal, bright field image, and merged image, respectively. Scale bars 15 μm (left two columns) and 20 μm (right two columns).

