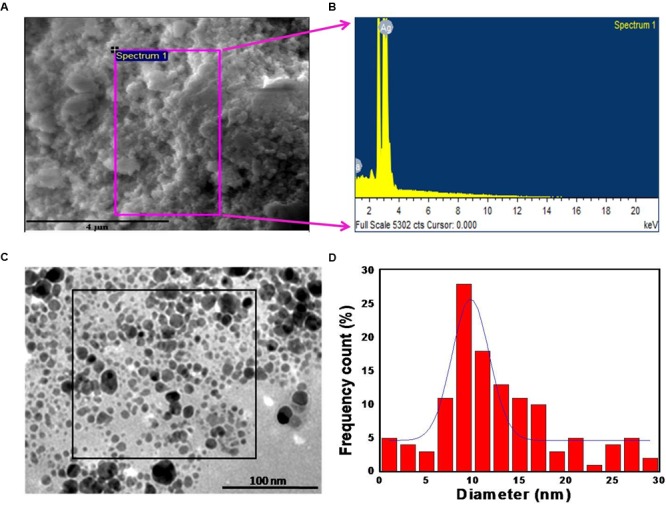
FIGURE 2.

Morphological and chemical characterization of M. hiemalis-derived AgNP. (A) SEM image of biogenic AgNPs (scale bar indicates 4 μm); (B) EDX spectrum of biogenic AgNPs; (C) TEM image of the biogenic AgNPs (scale bar indicates 100 nm); (D) histogram of the size distribution of biogenic AgNPs.
