FIGURE 2.

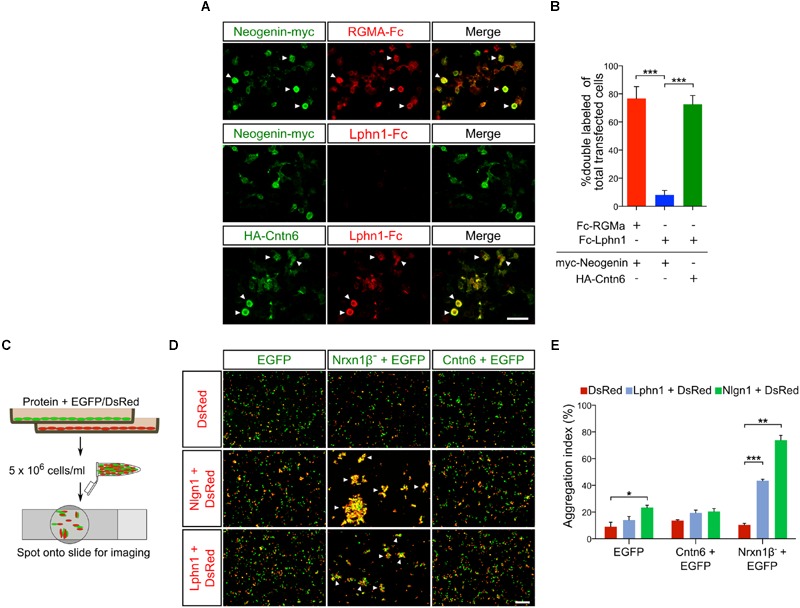
Cntn6 and Lphn1 interact in cis-configuration. (A) HEK293 cells expressing myc-neogenin or HA-Cntn6 were incubated with soluble ecto-domains of RGMA-Fc and Lphn1-Fc. Upper panel: neogenin-myc-expressing cells (green) bound soluble RGMA-Fc (red), but not Lphn1-Fc (red) (middle panel). Lower panel: HA-Cntn6-expressing cells (green) bound soluble Lphn1-Fc (red). Scale bar represents 50 μm. Arrowheads indicate green and red overlay. (B) Quantification of about 400 transfected cells per transfection condition of each independent cell surface binding assay (n = 3) was performed. (C) Schematic overview of the intercellular cell adhesion assay, in which populations of HEK293 cells were cotransfected with different cell adhesion proteins and either EGFP or DsRed expression plasmids. Two HEK293 cells populations were combined in a total of 5 × 10⁶ cells/ml. After incubation, cell suspensions were spotted onto slides for imaging by fluorescence microscopy. (D) Cells expressing either EGFP alone or together with Nrxn1β- or Cntn6 (green) were mixed with cells expressing DsRed alone or together with Nlgn1 or Lphn1 (red). Aggregation of cells expressing Nrxn1β- + EGFP with Nlgn1 + DsRed and Lphn1 + DsRed was observed. There was no aggregation of cells expressing Cntn6 + EGFP with Lphn1 + DsRed. The scale bar represents 200 μm. Arrowheads indicate cell aggregates. (E) Aggregation index was determined from five fields of 1.509 mm2 per cell suspension combination of each independent cell adhesion assay (n = 3). Analysis was performed using unpaired Student’s t test. The graph bars are presented as mean ± SEM. ∗p < 0.05, ∗∗p < 0.01, ∗∗∗p < 0.001.
