FIGURE 3.

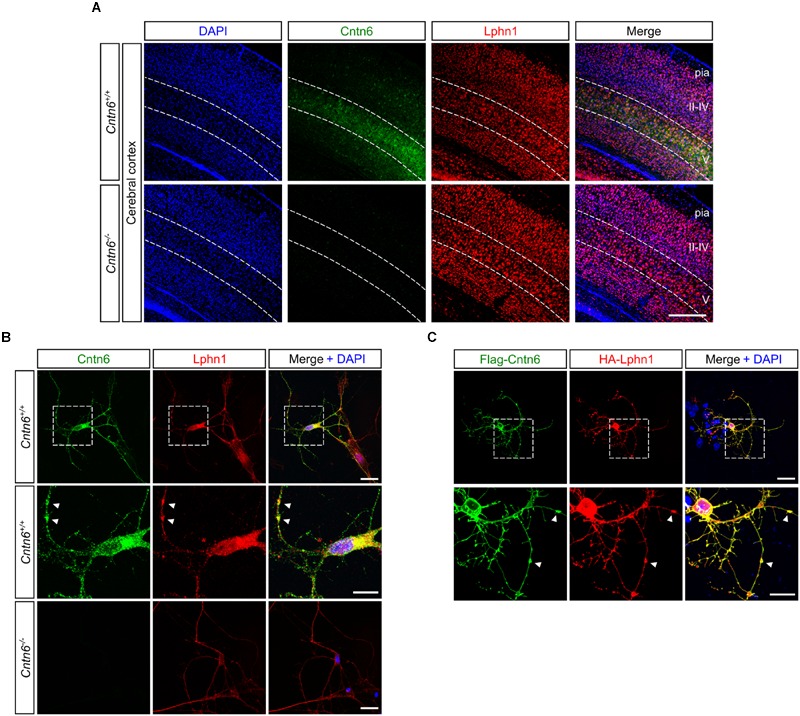
Cntn6 and Lphn1 colocalize in the cortex. (A) Immunostaining of Cntn6 (green) and Lphn1 (red) in wild-type and Cntn6-/- P14 animals demonstrating the coexpression of the proteins in layer V of the mouse cerebral cortex. DAPI staining is in blue. Scale bars represent 250 μm. (B, upper panel) Endogenous Cntn6 (green) and Lphn1 (red) colocalization is visible in wild-type primary cultures as opposed in Cntn6-/- primary cultures (B, bottom panel). DAPI staining is in blue. The scale bars indicate 20 μm. Middle panel show higher magnifications of boxed areas from the upper panel. The arrows indicate sites where the signals of Cntn6 and Lphn1 are clustered on neurites. The scale bar indicates 10 μm. (C) Cortical neurons were cotransfected with Flag-Cntn6 (green) and HA-Lphn1 (red) expression plasmids and immunostained after fixation. DAPI staining is in blue. Colocalization is visible throughout the neuron, The scale bar in the upper panel represents 20 μm. Lower panel shows higher magnifications of the boxed areas in the upper panel, with arrows indicating sites where the signals of Cntn6 and Lphn1 are clustered on neurites. The scale bar indicates 10 μm.
