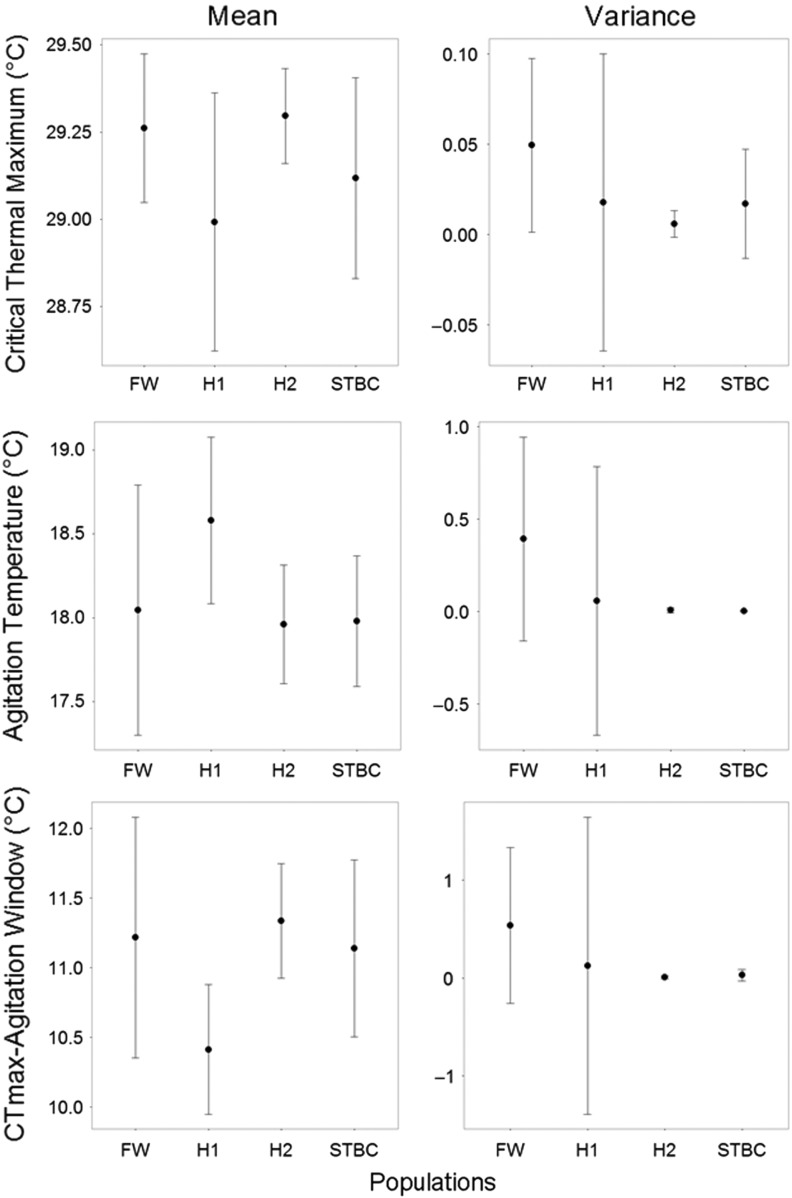
Figure 4:
Means and 95% confidence intervals for critical thermal maximum (CTmax), agitation temperature and CTmax–agitation window (mean response values and mean variance) for one pure–hybrid comparison. Freshwater (FW; large population) was crossed with Still There By Chance (STBC; small population). A statistically significant difference in mean CTmax was found between FW and H1 (d.f. = 22.15, F = 3.37, P = 0.02). H1 and H2 represent reciprocal F1 hybrid crosses.

