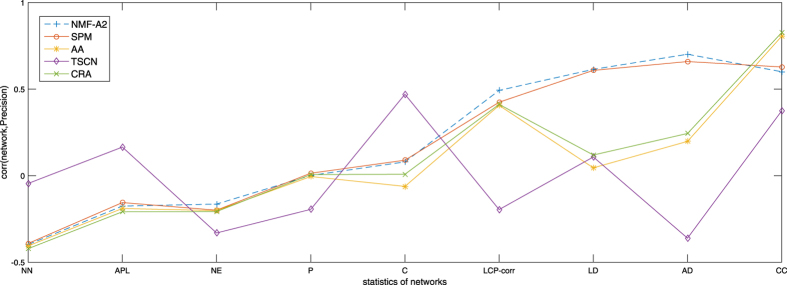
Figure 4. Correlation between precisions of four indices and statistics of networks where, NN, NE, LD, AD, APL, CC and P are the number of nodes, the number of edges, the link density, average degree, average shortest path length, clustering coefficient, and pearson assortative coefficient of the network, respectively.
C is the average closeness for all the pair nodes of the network. LCP-corr is the correlation between LCP and CN indices presented in ref. 11.

