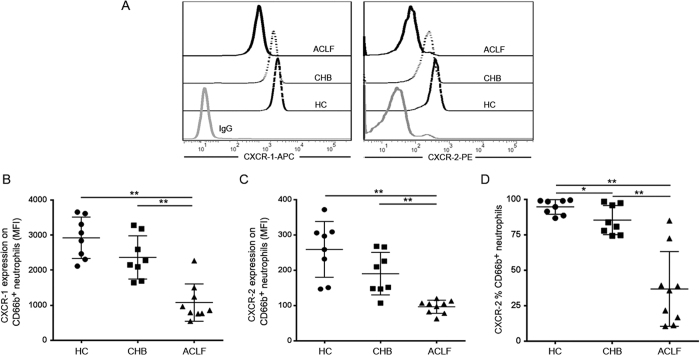
Figure 4. Effects of ACLF patient plasma on CXCR1 and CXCR2 expression on neutrophils from healthy donors.
(A) Representative dot plots show the MFI of CXCR1 and CXCR2 expression on CD66b-positive cells in normal neutrophils incubated with ACLF patient plasma. (B) Pooled data show the MFI of CXCR1 expression on CD66b-positive cells when exposed to ACLF patient plasma in vitro. (C) Pooled data show the MFI of CXCR2 expression on CD66b-positive cells when exposed to ACLF patient plasma in vitro. (D) Pooled data show the percentage of CXCR-2 expression on CD66b-positive cells when exposed to ACLF patient plasma in vitro. Data indicate the means and standard deviations. *P < 0.05; **P < 0.01.

