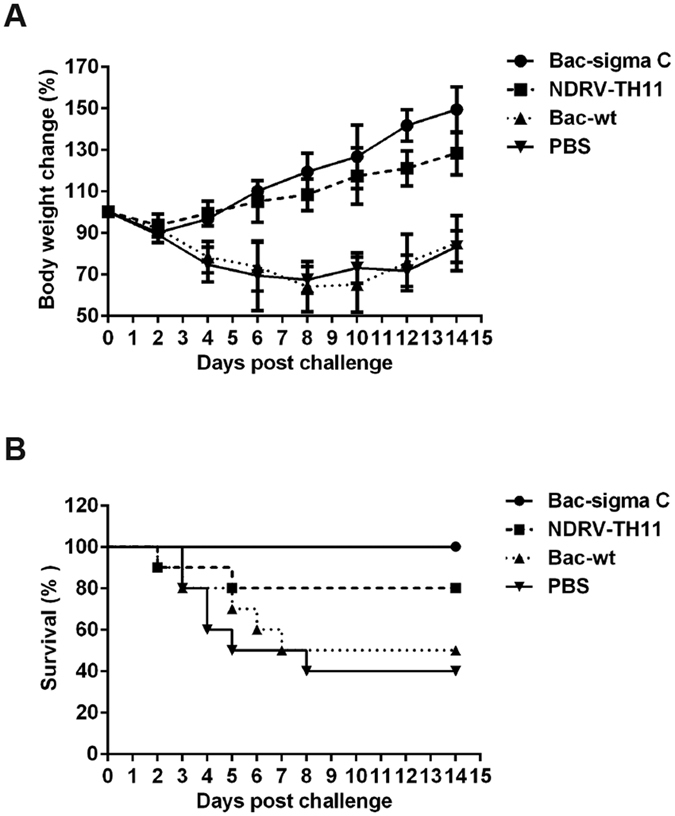
Figure 5. Weight loss and survival rate in ducklings after lethal challenge.

(A) Weight change was calculated for 14 d after virus challenge and is presented as the mean ± SD percentage of the original body weight. (B) Survival curves after challenge. The statistical significance of differences in mortality between groups was determined using the Kaplan-Meier method, and analyzed with a Log-rank (Mantel-Cox) test. For Bac-sigma C vs. PBS, P < 0.05; for Bac-sigma C vs. Bac-wt, p < 0.05; and for Bac-wt vs. NDRV-TH11, p > 0.05.
