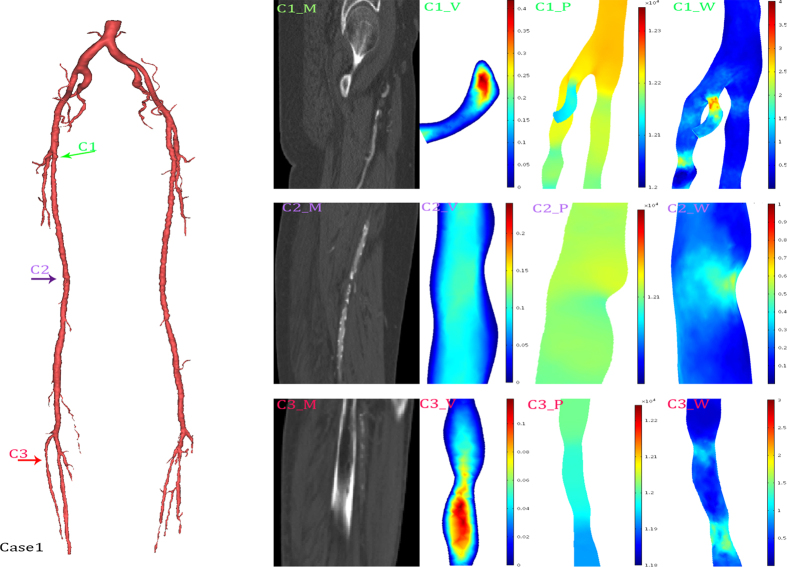
Figure 4. Hemodynamics distributions of the case 1.
The reconstructed model in 3D (left), and its typical geometrical features were marked with colored arrows. The first column (C1_M, C2_M, C3_M) were MRI data; the second column (C1_V, C2_V, C3_V) were slice rendered velocity distribution, the unit of the color bar was m/s; the third column (C1_P, C2_P, C3_P) were pressure distribution, the unit of the color bar was Pa; the fourth column (C1_W, C2_W, C3_W) were distribution of the mean diastolic wall shear stress, the unit of the color bar was Pa. Each row described the same geometrical feature marked in the 3D model and MRI data.

