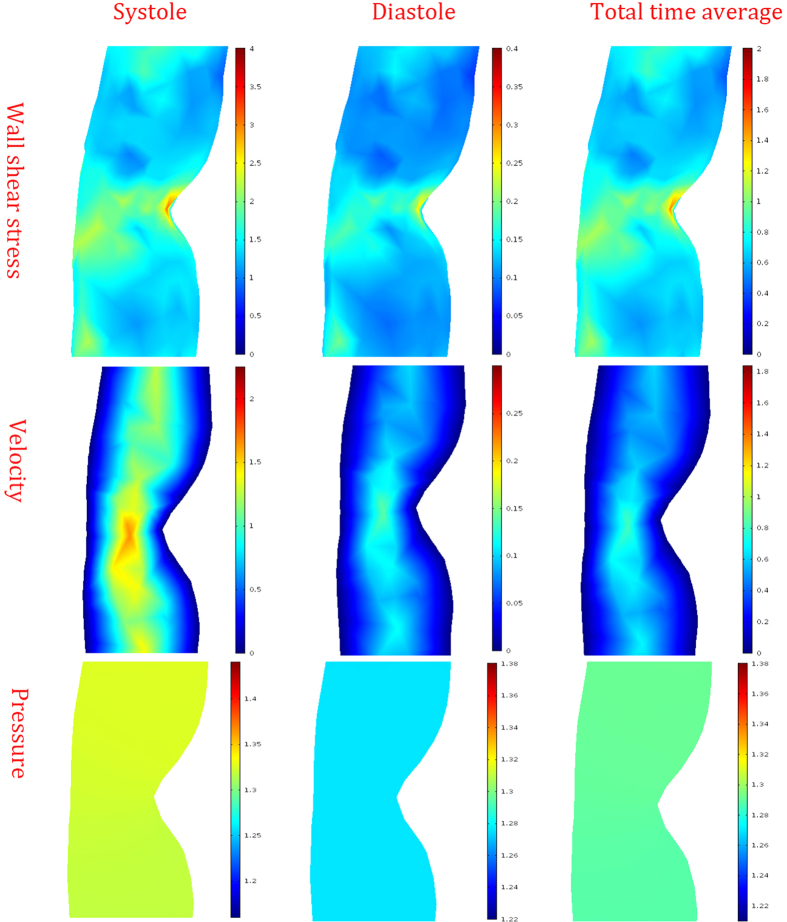
Figure 7. Hemodynamic distribution of different periods.
The distributions of the wall shear stress were showed in the top column, the unit was Pa. The distributions of the velocity were showed in the middle column, the unit was m/s. The distributions of the pressure were showed in the bottom column, the unit was 104 Pa.

