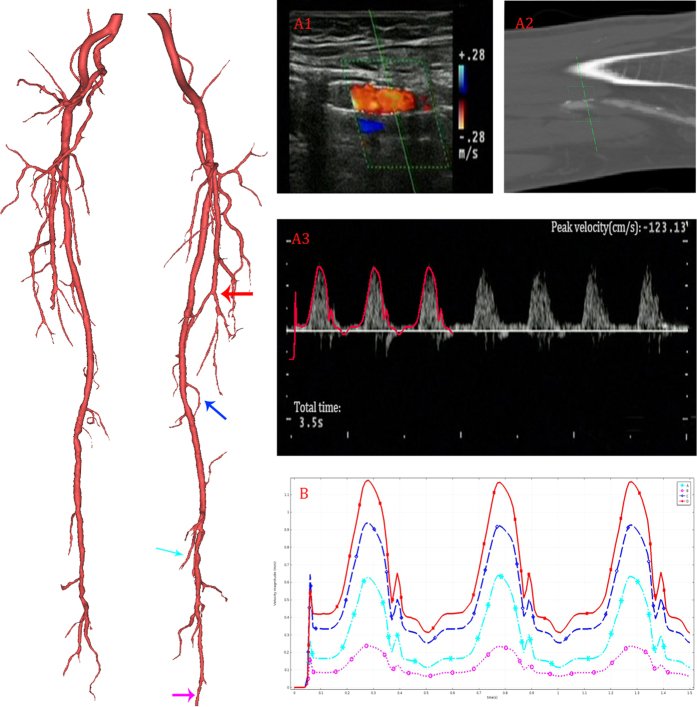
Figure 8. Computational results of velocity profile.
The reconstructed model in 3D (left), and UDV measured location was marked in red arrow. The UDV measured result was shown in A1. The corresponding location of MRI data was shown in A2. In A3, the calculated velocity profile (outlined in red) are overlapped on the UDV measurements to validate the accuracy of the simulation. The velocity profiles of four typical outlets (marked by colored arrow in 3D model) calculated by CFD are shown in B.

