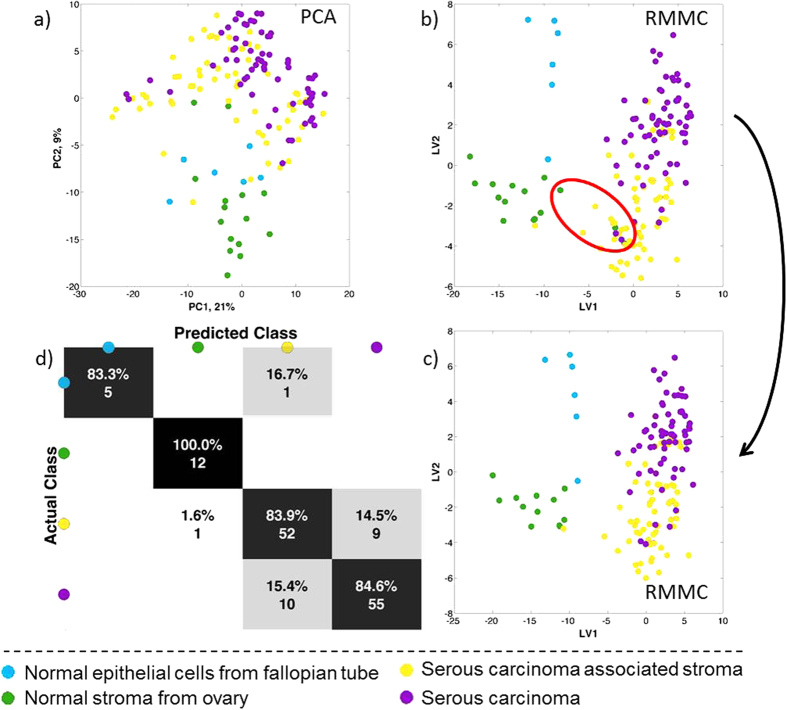
Figure 3. Statistical analysis of DESI-MSI spectrum between 600–1000 Da from serous carcinoma samples with two tissue types (stroma and carcinoma) together with normal stroma from normal ovary and normal epithelium from fallopian tube.
(a) Principal component analysis (PCA) and (b) Maximum margin criteria analysis (RMMC) and (c) RMMC analysis after excluding the 3 normal appearance stroma from cancer patients with respective (d) leave one patient out cross validation using Mahalanobis as a classifier.

